


Guardian Datastore editor Simon Rogers: Rogers said: 'We're not just data analysers, we've become data providers'
Data is the "new normal" in journalism, according to Simon Rogers, the editor of the Guardian’s Datablog and Datastore.
The aim of the Guardian when it comes to data is to guide the public through the mass of information available and present it in an attractive and easy-to-understand format.
Speaking at the PPA (Professional Publishers Association) conference this week Rogers said: "What's happening is we're not just data analysers, we've become data providers.
"What we’re doing is essentially journalism, but it’s different journalism. The root of it is all about the stories."
In his presentation to delegates, Rogers outlined 10 ways data is changing journalism today, using examples from the Guardian’s own Datablog to illustrate new techniques and tools used to visualise data for a variety of news stories.
Here are five of the best examples he shared from the Guardian Datablog:
1) Anders Breivik’s manifesto mapped
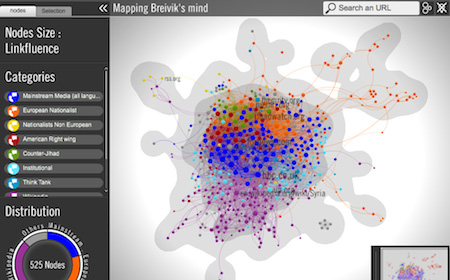
When the man behind Norway’s bombings and shootings in July of last year released his 1500 page-long manifesto, data journalists at the Guardian teamed up with French company Linkfluence to produce a visualisation of the relationships between the sites linked in Breivik’s manifesto.
From the Guardian: "To appear on it does not make anyone responsible for Breivik's actions. Rather it shows how a conspiracist mind can twist perfectly normal stories into a threatening and dangerous pattern."
2) Reading the Riots
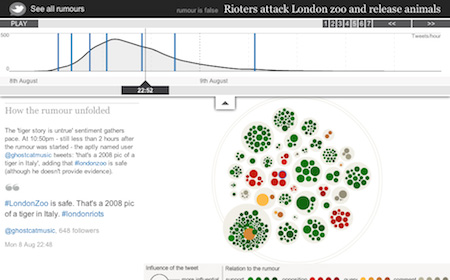
Plenty of data was generated during London’s riots in the summer of 2011. Visualisations included comparing the Guardian’s poverty map with the addresses of those arrested as well as looking at how far from home rioters travelled before they were apprehended.
The Guardian also analysed how Twitter rumours developed during the riots, from their inception to their eventual rebuttal by users on the social networking site.
Rogers said: "You know that whole saying, ‘a lie can be twice round the world before the truth has got its boots on’? With social media, the truth can catch up."
3) EU budget
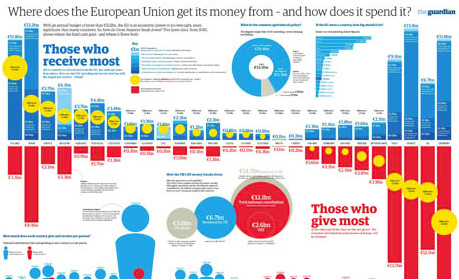
Working with other European news outlets, the Guardian answered how the EU spends its budget in a graphic visualising statistics from each member state.
Graphic artist Paul Scruton outlined the key data in an eye-catching format, revealing where the money comes from and who receives the most.
From the Guardian: "With an annual budget of over €122bn, the EU is an economic power in its own right, more significant than many countries. So, how do those finances break down? This latest detailed data - from 2010 - shows where the hard cash goes - and where it flows from. As part of our Europa series, we wanted to look at how the figures break down."
4) Gay rights in America
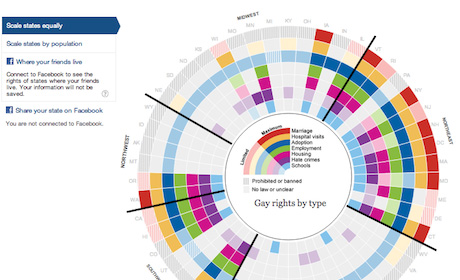
The news outlet’s interactive team in America took a different look at the issue of gay rights in America by setting out an interactive graphic of gay rights laws in America, state by state.
They took a look at key legislation affecting areas like marriage, adoption and hate crimes to build a picture of each state’s situation. Users are also able to link the data to their Facebook profile to show the rights of states their friends live in.
5) Government spending by department
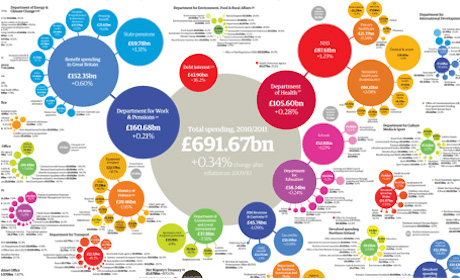
Visualisations do not always have to be interactive to make an impact, according to Rogers. Although he revealed mapping out the UK government’s spending by department still took a fair bit of digging.
"If we lived in the States we'd be able to get some of this data easily," he said. To add to this, the data was all in PDF documents, which made the task all the more difficult. But the end product is a useful and informative graphic detailing where the £691.67bn the Government spent in 2010-2011 went.
Free daily newsletter
If you like our news and feature articles, you can sign up to receive our free daily (Mon-Fri) email newsletter (mobile friendly).


