

As such, he outlined 13 examples of data journalism from across the world, both big and small, highlighting what is possible.
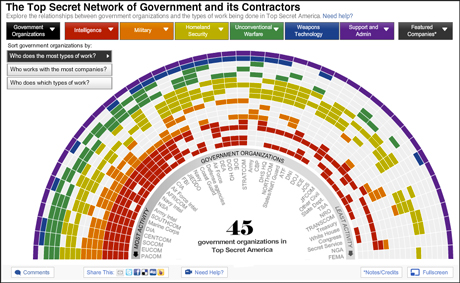
1. Washington Post – Top Secret America
This is an investigation into arms procurement. The Post "wanted to find out what tax payers' money was being spent on", Arenstein said, explaining that it is still being added to "it's a living recourse on military spending".
The investigation has provided traditional stories, and as the data was geocoded the Post was able to plot the information on a map. And by plotting data they were able to find patterns - and see relationships between arms spending and manufacturing and the constituencies where politicians involved in procurement process are based.
The Post has "also created a visible database", Arenstein said. In a newspaper you have limited space so you cannot report on this, he explained, whereas the web has the advantage in that underlying research can go online and be used as a resource. Google calls these "living stories", Arenstein added.
2. Washington Post – Healthy life expectancy
The topic of healthy life expectancy "could be a dry subject", Arenstein said, and the Post's solution? "To put the person in the story" by making it interactive. "It encourages people to spend more time engaging," he said.
3. Guardian – Gay rights in the US interactive
This example is "less to do with numbers" and more to do with information and localising that information. "It's real narrative information," Arenstein argued.
4. Bloomberg – Bloomberg Billionaires
Here Bloomberg allows readers to interact with the information on the world's richest people, filtering to find out whether they inherited their wealth or earned it.
5. Google – Flu trends
Data can be predictive, Arenstein said, explaining how the flu trends study looked at what people were searching for in Google (keywords such as 'cold', 'flu', 'tissues') and then looking at how reports of flu mirror the search pattern. Projects like flu trends shows "what are people interested in before it's news?'".
6. Veja.com – The scandal meter
Brazilian news outlet Veja.com extracted data from their archives going back to 1985, creating an interactive of the results which allows the user to search linkages.
Smaller scale examples
7. The Globe and Mail – The 'Who had it Worse' machine
The Canadian news outlet "built the tool so it could go viral", Arenstein said. Then they looked at analytics to see who was sharing and interacting. By doing so they could see the demographics who are interested in this type of story.
8. ProPublica – Prescriber Checkup
This example from not-for-profit investigative news outlet ProPublica is a tool which lets users find and compare doctors and other top drug prescribers.
9. The Star Health, Kenya – Dodgy doctors
This data journalism interactive cost just $500 to build and has so far taken four work days, including one programmer and two journalists. In the same way as ProPublica created a health portal page in the last example, the Kenya title created a tool to allow users to search for registered doctors.
Arenstein told an anecdote which outlined the importance of such a tool, explaining how someone fell ill, called who he thought was a doctor, was treated but it turned out that the man was not a doctor but a vet.
The Kenyan title is both monetising and opening the tool to those not online. They are providing results by SMS, charging a premium text message rate.
10. Gottavote, Kenya
Election information was provided in a lengthy PDF, Arenstein explained, so one coder and one journalist worked together to build the Gottavote app, making it easy for people to get the information. They then created a message-sharing app so Kenyans could encourage one another to vote. The interactive generated as much traffic as the news content on the election, Arenstein said.
11. Where my money dey? Ghana
This tool allows people to search for their area and tells them how much money has been received by officials. It was built for just $250, with volunteers making it possible, and the newspaper is now on board and pointing people to the tool.
12. Find My School, Kenya
This tool advises parents which schools would be best for their children, based on data.
13. Great Schools
This example from the US does exactly the same as the Kenyan project above.
Newsrooms might say these tools are not the product of a newsroom, Arenstein pointed out, but they "anchor content" and "build loyal audiences around content".
Arenstein's slides are at this link and the raw 'live notes' on the session are at this link.
Journalism.co.uk is in Bangkok for the World Editors Forum. Follow @SarahMarshall3, @JohnCThompson and #editors13 for updates.
Free daily newsletter
If you like our news and feature articles, you can sign up to receive our free daily (Mon-Fri) email newsletter (mobile friendly).


