'Data+Design': free ebook released for data visualisation
More than 50 volunteers worked on a free ebook to explain visualising and working with data to those with no specialised training


More than 50 volunteers worked on a free ebook to explain visualising and working with data to those with no specialised training

This article was migrated from an old version of our website in 2025. As a result, it might have some low-quality images or non-functioning links - if there's any issues you'd like to see fixed, get in touch with us at info@journalism.co.uk.
A free ebook on data visualisation was launched earlier this week to make the practice more accessible to those without specialised training.
Trina Chiasson, co-founder and CEO of crowdfunded data visualisation start-up Infoactive , started work on Data + Design after receiving a request for data tutorials from a contributor. The ebook was also made available as an open source project on GitHub .
"One of our goals for the book was to make it easier for people that are more design-oriented," Chiasson told Journalism.co.uk, "or communications-oriented, or don't have that background in statistics, to be able to make sense of data and understand what they need to know, because a lot of text books about data are written by technical people and never edited for non-technical audiences.
"So a big part of this for us was making a guide that's very conversational and very friendly, something that designers would want to read rather than something that designers look at and they say 'oh you know this is a lot of maths talk, this isn't for me'."

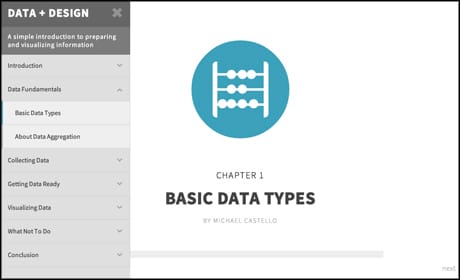
Ebook screengrab from Infoactive.
The book was written by over 50 volunteers, who took on different roles including editing for tone and English as a second language.
"We had tone editors who were editing to make sure that it felt conversational and approachable and friendly", said Chiasson.
"And these people had a specific qualification in that they couldn't have a background in maths or statistics, because we wanted them to make sure that it was understandable to people who didn't have that kind of background."
She said Data + Design was an ongoing project, with more chapters and translations on its way. Some of the topics featured in the current edition include data fundamentals, how to collect data, and what not to do when working with data. Chapters on graph and chart types, and colour perception theory are in the works.
Chiasson said working with data and analysing it is becoming an increasingly important part of the business landscape, but a lot of people have not been taught that much about it.
"You put a tiny snippet of Google Analytics code on your site and all of a sudden you have this massive quantity of data that's being generated for you," she said.
"And a lot of people have access to very rich data sources, but I think that understanding of what to do with that data is still lagging behind."