Piktochart launches new infographics tool with interactivity
The new app features interactivity features such as hyperlinks and interactive tabs to enable more information to be presented
– 2 min read
The new app features interactivity features such as hyperlinks and interactive tabs to enable more information to be presented
This article was migrated from an old version of our website in 2025. As a result, it might have some low-quality images or non-functioning links - if there's any issues you'd like to see fixed, get in touch with us at info@journalism.co.uk.
Infographics platform Piktochart
has launched a new graphics-building app which offers interactive features on a "completely new and user-friendly dashboard".
Piktochart had previously launched a platform for building infographics, but stressed today's launch is a completely new app.
Speaking to Journalism.co.uk, Piktochart chief executive Ai Ching Goh said "the main and the biggest change is in the simplicity of using or creating infographics".
"Over time we've had about 170,000 users giving us feedback and that has helped us to make something that's simpler, and we're trying to cut down on the time that is needed to create an infographic."
Other changes include the ability to export the final infographic in a number of different formats, instead of just an image as before. Other options now include exporting the graphic as a web link with the infographic hosted on Piktochart, or by embedding the graphic on another site.
The new interactive features include the ability to add hyperlinks to certain points of the infographic, as well as using interactive tabs to input additional information. Journalism.co.uk built the example below to highlight how the interactive tabs feature appears. If this interactive was complete, and then embedded into this article, users would be able to click on the 'sharing the results' tab to see more information.
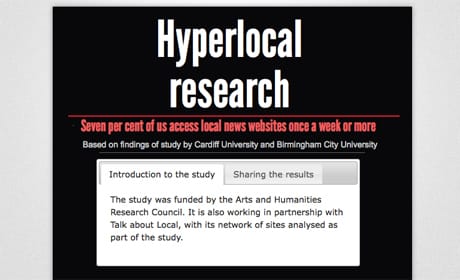
"It's like tabs when you use a browser, you'll be able to sift through different parts of information in one place," Ai Ching Goh said.
"When people use infographics quite a lot of them use them for presentation purposes and because of that the infographics actually stretch quite long, and having it organised in tabs is quite useful."
She added that the new Piktochart platform is "trying to help the users who might have sometimes a bit too much information".
"The tabbing is just one of the solutions that we're thinking of."
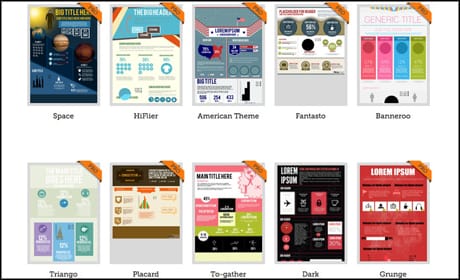
The new platform also offers more graphics for users to choose from.
"Previously each theme had about let's say 50 graphics, and now we've just merged all of those themes together so you have a couple of thousand of graphics to play with," she said.
A release adds that another feature of the new platform is that the "output or exports of infographics from the new Piktochart are search engine friendly and this can help customers strengthen their marketing strategy".
It adds that this is "a benefit that was previously not available via image-based infographic files."
Piktochart, which has previously been a Journalism.co.uk tool of the week , is available as a free tool with a cap on the number of themes available, while the paid-for version opens the user up to more than 100 themes.
The release also states that the company, which is based in Malaysia, "is looking at making Piktochart mobile friendly to users in the near future".
The image below shows just some of the themes on offer.