

It is essentially a way to create an embeddable timeline with cards of text or multimedia to explain key moments in the story. As an example, Al-Jazeera America used it to good effect in explaining the events in Egypt in the summer of 2013.
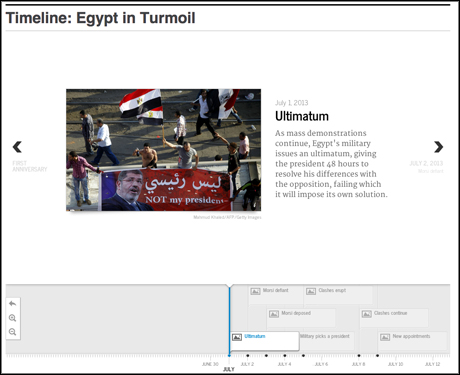
Screenshot from Al-Jazeera America
The above screencast goes into detail on how to use the tool, but if here's a quick run down of the steps if you don't have time for the video.
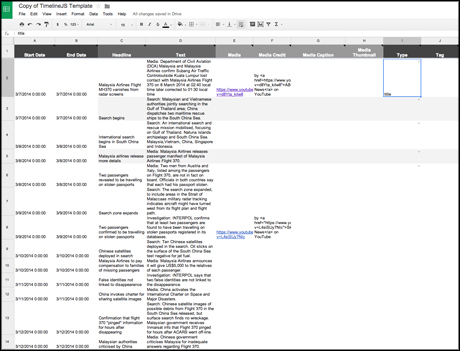
1. The back end of each timeline is created in a Google spreadsheet, so go to the Timeline.Js website and scroll down to the "create your spreadsheet". The tool inventors have created a handy spreadsheet template so open that up to see what you need.
2. The different columns are fairly self explanatory but let's go into them in a little detail.
- Start date – The date on which you want the card to start. You need to write it in the American format (MM/DD/YYYY) or it will not work.
- End date – This is the end date for the card which can span several days or weeks, depending on the duration of the relevant point.
- Headline – Each card has a headline, which you add into the third box.
- Text – This is where you add the main body of the text for the card.
- Media – Here you can add the URL to a piece of video from YouTube or Vimeo, a picture from Flickr, an embed code for a Google map, tweets, instagram pics and much more.
- Media credit – the all important media credit appears directly under the embedded media. You can credit the source with a link by using the following HTML code: By source name on source website.
- Media caption – A caption for the images, it appears lower down from the caption, away from the text.
- Media thumbnail – The media thumbnail will appear in the card in the timeline, but most visual media sources will generate a thumbnail automatically. If you want to add your own, it needs a 32px by 32px image.
- Type – This designates the type of card. The most important thing to add is "title", as that will put that card at the front of the timeline. Although you can add "era" in here too to show the cards in certain eras, era cards cannot display media.
- Tag – The tag box lets you add tags, like any other blog post or article.
3. Once you have added and organised all your text, headlines and credited media, go to 'File' in the menu bar of the spreadsheet and click "Publish to the web". Then click the "start publishing" button and Google will generate a URL.
4. Copy and paste the URL and then add it to the generator box on the Timeline.js site. There are a number of customisation options if you want to go into greater detail, but the basic timeline option still looks great.
5. Scroll down and you can generate a preview to see how your timeline looks, before copying the embed code to embed it into your article.
Timeline JS is one of many tools journalists can use to make their online work more engaging for the reader. If you want to find out more about boosting engagement online, Journalism.co.uk will be running a session on the subject at our next news:rewired conference on Wednesday 23 July.
Free daily newsletter
If you like our news and feature articles, you can sign up to receive our free daily (Mon-Fri) email newsletter (mobile friendly).
Related articles
- What AI can do for your newsroom: tips from Ring Publishing's latest handbook
- 200 speakers you need at your next journalism event to avoid all-male panels
- How young leaders can shape the future of the media industry
- Tools, tactics, and success stories of newsroom innovation in 2023
- How news brands can win over young audiences, with Danuta Breguła


