Infogr.am launches so journalists can easily create infographics
Data visualisation tool launches in public beta enabling digital journalists to create and embed infographics without the need for code and design skills

– 1 min read
Data visualisation tool launches in public beta enabling digital journalists to create and embed infographics without the need for code and design skills
This article was migrated from an old version of our website in 2025. As a result, it might have some low-quality images or non-functioning links - if there's any issues you'd like to see fixed, get in touch with us at info@journalism.co.uk.
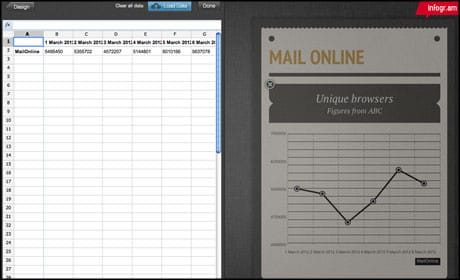
A free-to-use tool has launched to allow for the easy creation of infographics. Infogr.am allows digital journalists to add data, images and text to create embeddable visualisations without the need for code or design packages.
The tool, created by tech entrepreneurs HackFwd , was launched in public beta yesterday.
Users to login using Twitter or Facebook and have the choice of creating an infographic, of which there are three templates to choose from, or chart, which offers five templates.
An announcement on HackFwd's blog states: "With Infogr.am you can create and publish beautiful, interactive infographics based on any data you choose.
"You select a template, upload or enter your data for various graph types, add quotes, images and text, and decide the layout with a simple drag and drop interface. You can then take your infographics with you, embedding them anywhere or sharing them via social channels."
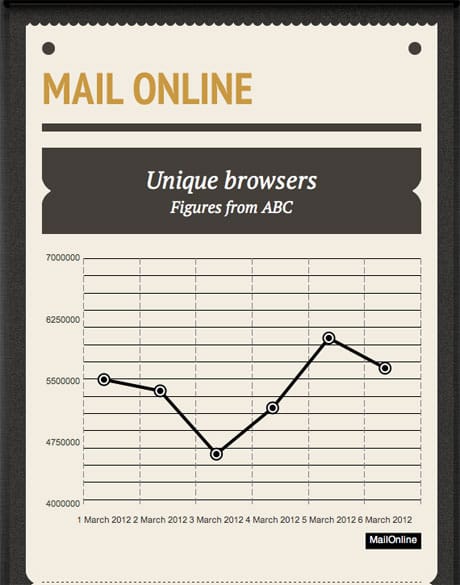
Our test infographic can be viewed at this link .