

Devices: iPhone, iPad
Cost: £1.49
What is it? A new app for creating quick charts on the fly
How is it of use to journalists?
We all know that data is sometimes most clearly presented in the form of a chart or graph. This app, which released on Monday (5 August), enables you to quickly create quick visualisations on your iPhone.
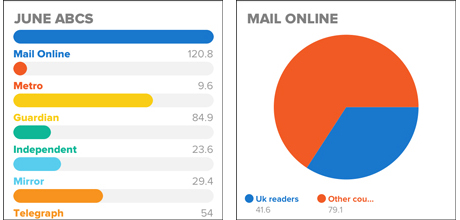
The results. Source of data: ABC
There are certain limitations. We created the test bar chart above by entering the ABC-audited figures for unique browsers to news sites. The app accepts a maximum of six lines of data, so we were unable to add the figures for some websites.
It also struggled to interpret large numbers, so we entered 120.8, representing the Mail Online's readership in millions, rather than the full figure of 120,829,031.
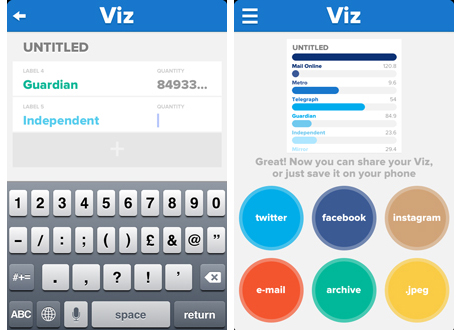
Once you have entered the data, selected the type of chart you want to create and picked a colour, you can then choose to share to Twitter, Facebook, Instagram, by email, or save it as a jpeg (as we did here in order to upload the graphic).
It is worth noting that unless you select to save your chart to the archive, the visualisation will not be saved and you will not be able to go back and edit it (which we discovered when we forgot to include a title).
Despite the limitations this is a great app and one journalists may find useful when presenting stories with numbers. It could be particularly effective for sharing stats story via Facebook.
Hat tip: The Next Web
Have you got a favourite app that you use as a journalist? Fill in this form to nominate an app for Journalism.co.uk’s app of the week for journalists.
Credit: Homepage image by Alexander Kirch, Dreamtime.com
Free daily newsletter
If you like our news and feature articles, you can sign up to receive our free daily (Mon-Fri) email newsletter (mobile friendly).
Related articles
- How AI can help journalists track MPs financial interests
- Tools for journalists: Missing Perspectives Directory, for connecting newsrooms with women
- Seven sources of free images for journalists
- 12 essential self-taught journalism skills
- App for journalists: Brain Bump, for pro tips and audience discovery


