


Data was collected by Al Jazeera English's Syria expert who made hundreds of phone calls to rebel groups
Credit: Image by Skeddy in NYC. Some rights reservedAl Jazeera English yesterday published an interactive that maps the Syria rebellion.
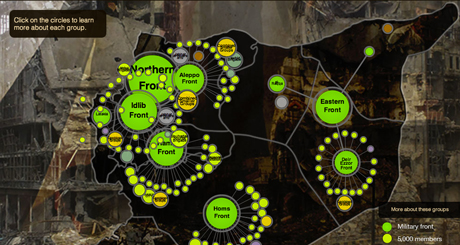
The interactive is based on data collected from 900 opposition fighter groups in the country, gathered though good old fashioned journalism. Al Jazeera English's Syria expert Basma Al Atassi made dozens of telephone calls to the groups on the ground, asking questions about the numbers of people involved in each group, where they are based, and noted other details.
The data was then handed to Mohammed Haddad, interactive producer at Al Jazeera English, who turned it into a force diagram, and interactive to show relationships between the groups.
This type of data-driven investigation, with the information gathered by Al Jazeera either through telephone calls or by crowdsourcing information from readers, is typical for the Doha-based news outlet when creating interactives.
Speaking to Journalism.co.uk as the interactive went live, Haddad explained how Al Atassi gathered the data over a two-week period.
"It is quite difficult to get verified sources other than by telephone, so she was calling them, finding out the context," Haddad said.
"She was doing what a typical journalist would do. A lot of people think data journalism doesn't consist of this step, and it actually does, we are using the same techniques as other journalists to start sourcing our stories."
He explained why gathering data is beneficial. "For stories where data is not readily available, we go though typical processes: we call people, get contacts, they pass us to someone who may know how to get more data. I think that's where the added value comes in, data journalism as a process of data collection."
Other interactives
Al Jazeera creates two types of interactives: explanatory pieces and data-driven investigations.
Explanatory interactives "explain how things work", Haddad said, and include timelines and tools such as the Vote Compass, which Al Jazeera has deployed for a number of elections and is designed to help people to choose a candidate to vote for.
Other explanatory interactives are used to explain complicated information, such as elections. "As everyone knows the election processes can sometimes be really difficult to explain through written form, so we take what would normally be quite a difficult read and transform that into a graphic of some sort," Haddad said.
Explainer graphics work well for Al Jazeera, he explained: "One of the reasons is people don't have time to go through lots of text explaining these difficult processes."
The other type of interactive is one based on a data-driven investigation, such as in the case of mapping Syria's rebellion. The news team gathers data, frequently crowdsourcing responses by asking people to send an SMS. Journalists then analyse the information and the resulting interactive should help readers "understand the 'why' in why is something happening", as Haddad says.
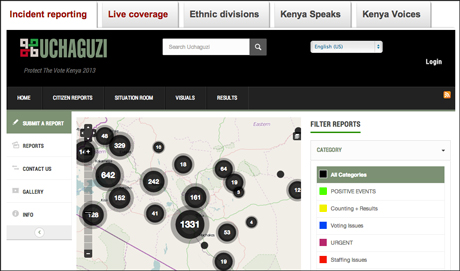
The outlet runs a series called Al Jazeera Speaks, such as this example on the Kenyan elections. "We typically send out SMS messages to areas that don't have good internet connection and we ask people certain strategic questions. We then analyse those results and present them as a visualisation, depending on what the results find," Haddad explained.
So what makes a successful visualisation? According to Haddad, it should answer a question. "We have had some unsuccessful visualisations," he said, "and those where when we didn't truly answer what needed to be communicated and we did not provide the right level of detail that our readers were looking for.
"For example, for the first Egyptian elections we thought we'd go really deep into data and present results from every single governorate, so it was very data-driven, there was lots of data collected, lots of analysis. But on the day of publishing there was too much information for our readers. We were late in getting it out and people had already looked at the elections. So there's a combination in factors we need to look at before embarking on one of these interactive projects."
Another example of a data-driven interactive is the Syria Defector Tracker, which his won an Online Media Award for best technical innovation.
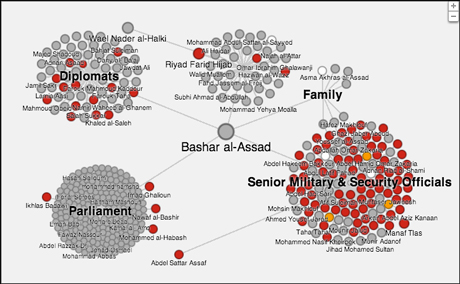
Haddad explained that it was a quick turnaround project. "We worked with the Google Ideas Group. They had come to us saying they were interested in partnering with Al Jazeera on essentially mapping out or presenting all the defections that are happening in Syria."
Initial research was carried out by looking at online reports of defections. That information was handed to Al Jazeera Syria expert Basma Al Atassi who worked to verify the data.
The resulting interactive, which was also created as a force diagram to show relationships (a screen grab is above), was used both by Al Jazeera English and on the Arabic language site.
And this is an example of where an interactive can tell the story better than a text article, according to Haddad. "If you were to write it as a feature, you would not be able to present the information as there were hundreds of names, hundreds of videos. It was a great way of presenting a lot of data in a structured manner so people could consume or explore the data for themselves."
Another example of web native storytelling from the team is when they created interactive video transcripts of last year's US presidential debates. This was led by Mark Boas, who was one of last year's Knight-Mozilla fellowship winners and spent a year working with the Al Jazeera team.
The team behind the interactives
Haddad is the lone developer working with a team of around 40 journalists to build data-driven interactives. A designer joined just last week.
The starting point for an interactive usually comes from one of the journalists, who will pitch an idea much in the same was as they would suggest a feature.
Haddad and the journalist then work together to understand the concept. The next step is to gather the data, which typically takes two or three days, and then they work on visualising it.
"No project we have worked on has taken more than 10 days," Haddad said, "just because we want to try and get stories out there."
Haddad, who studied computer science and information systems, joined the team two-and-a-half years ago. Coming from a programming and business analysis background and then being introduced to journalism – and being introduced to journalism at a time when there was a lot of news happening in this part of the world – meant I had to quickly grasp what it takes to write stories, to communicate our message."
Sometimes the message is most effectively conveyed through a video, at other times by in-depth analysis and long-form text, he said. "And there is a space for those visual consumers of news who want to not only read explanations of how things are happening but also see the relationships between them. I think that is where we can all work together and complement one another's work."
Free daily newsletter
If you like our news and feature articles, you can sign up to receive our free daily (Mon-Fri) email newsletter (mobile friendly).


