

A free Visually tool allows you to compare two Twitter accounts
Infographics platform Visually has launched a marketplace to connect designers with those needing infographics, such as news outlets.
The platform will also provide opportunities for journalists and storytellers, as they can be commissioned work on a data visualisation that requires journalistic research, Stew Langille co-founder and chief executive of Visually told Journalism.co.uk.
News outlets, or those who want to commission an infographic, do so by using the marketplace, paying from $1,495 for a design or requesting a "design and storytelling" package for $2,995.
The launch of the ecommerce and project management part of the platform taps into "Visually’s vibrant community of more than 45,000 designers," the company said in a release. It links up those requiring a visualisation with its community of designers, data journalists and analysts, Langille said.
He added: "We built the marketplace in order to enable collaboration among the various parties that are needed to make infographics and data visualisations.
"There is a great need for storytelling in the visual realm and the skills that a journalist brings to the table are extremely valuable. One of our goals with the marketplace is to provide people with storytelling skills and journalism expertise a platform that they can use to exercise this."
Visually launched in July 2011 as a platform to enable users to explore and share data visualisations. This July it repositioned as a "social network for infographics".
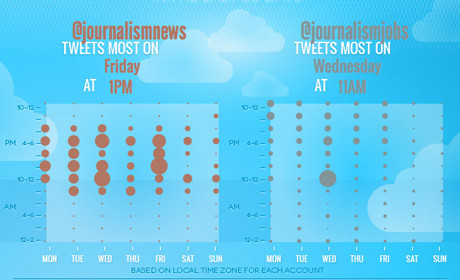
Visually also offers a few free tools that enable anyone to create an infographic, such as this one for comparing Twitter accounts (here we have compared our @journalismnews channel and @journalismjobs channel), and this one for tracking the "life of a hashtag".
Free daily newsletter
If you like our news and feature articles, you can sign up to receive our free daily (Mon-Fri) email newsletter (mobile friendly).


