Sources and tools for data journalism
A speedy guide for journalists on finding data and tools for visualising it – with minimum coding skills required

– 9 min read
A speedy guide for journalists on finding data and tools for visualising it – with minimum coding skills required

This article was migrated from an old version of our website in 2025. As a result, it might have some low-quality images or non-functioning links - if there's any issues you'd like to see fixed, get in touch with us at info@journalism.co.uk.
Data Journalism: Mapping the Future
Data journalism: Mapping the future
The central repository of public data relating to the UK is the HM Government Data Portal , which hosts more than 10,000 datasets from all central government departments, as well as a range of public sector bodies and local authorities across the country. Most of the data available is free to download and use, and it is released under an Open Government Licence (OGL). The Department for Communities and Local Government shares a range of useful datasets, some with historical data, relating to indices of deprivation in England, national housing stock, the housing market and house prices, together with household population projections, among others. The NHS Information Centre for Health and Social Care is another major publisher, with data on health surveys for England, Accident and Emergency attendance rates, obesity statistics, NHS dental activity, statistics on smoking, drinking and drug use, maternity and GPs. The Environment Agency shares data on flood zones, river water quality and pollution incidents, while the British Geological Survey holds records of earthquakes in the UK and worldwide, data on mineral resources and historical maps. The Department for Transport publishes data on road safety, road casualties MOT tests and results (anonymised), while HM Revenue and Customs (HMRC) offers statistics on UK overseas trade, personal wealth, income tax data, and tax credits among other national indicators.
It is worth also checking individual departments’ websites, as sometimes not all the data is available in the same place, and it can be released on departmental sites before it reaches the Government Data Portal.
The Office for National Statistics (ONS), shares a wealth of datasets relating to the labour market, population, economy, business, population, crime and justice. Unlike some of the departmental datasets found on the HM Government Data Portal, the ONS releases data at regular intervals and maintains a release calendar on its website, which can be useful for planning data-driven editorial.
For example, labour market statistics – both national and regional – as well as the Retail Price Index and some economic indicators are released on a monthly basis, which can be used to generate stories on unemployment and benefits claims.
As with the Government Data Portal, most of the data from ONS is available in Excel or CSV format, for compatibility with visualisation tools.
There are also a number of UK regional statistics bodies, often called observatories, maintained by local authorities. Such examples are the Lincolnshire Research Observatory and the Cumbria Intelligence Observatory , which hold detailed breakdowns on population, economic and health data for the regions they cover, and can be useful for local and regional stories alike.
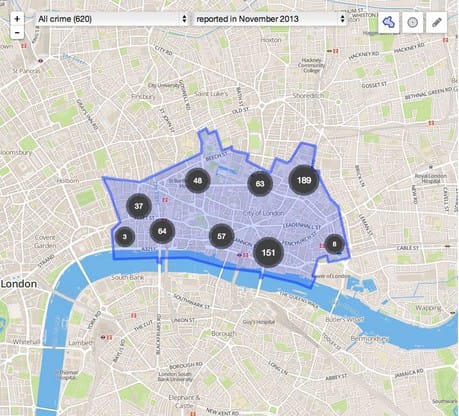
Screenshot from Police.uk showing reported incidents of crime in the City of London area in November 2013
For detailed crime statistics, the Police.uk website allows journalists to not only get a visual look at crime across the country and regions, but drill down to street level by types of crime.
When the Ministry of Justice, Home Office and local police forces initially launched the tool, it was mainly a visual way for citizens to check the performance of their local policing team and get an overview of criminal activity in their area. But Police.uk has been improved in the past two years and can have a real value for data journalism, especially for local journalists.
The data is now updated on a monthly basis, and users can draw the area they wish to see crime statistics for on a map, no longer limited by a radius around a postcode. The website gives a breakdown of the crime types recorded for areas selected, outcomes of police action, as well as comparison views with other areas or historical data.
Additionally, the data can be downloaded in CSV format, meaning it can be used with external tools to overlay, for example, the relation between deprivation or poverty data from ONS and crime levels for certain areas in a city.
The United States government maintains its central data on Data.gov , which hosts datasets from individual US government agencies, as well as an extensive list of similar sites for cities such as New York , states, and countries such as Canada , France, Kenya and Saudi Arabia.
The US data portal also hosts links to a range of other organisations sharing data, such as the Organisation for Economic Co-operation and Development (OECD), which shares core data from 34 member countries on demography, economy, education, environment, finance, health and transport.
Screenshot from data.un.org
Similarly, the United Nations (UN) has a comprehensive data portal hosting datasets on a range of topics, including fertility, energy use, and environment statistics, while the World Bank shares datasets about development in countries across the globe.
For detailed European data, Eurostat from the European Commission holds detailed statistics and economic indicators datasets from countries across the continent along with a handy release calendar for editorial planning.
There are also a handful or dataset aggregators that can be useful when researching data sets. Such examples are Knoema , which claims to be the largest public and open data repository in the world, Datahub , and Data 360 , which hosts a mix of datasets and data visualisations.
Data leads can come from a range of other sources which journalists can turn to for inspiration.
Charities and non-profit organisations often gather data indicators to highlight various issues, such as homelessness, abuse or social mobility – all of which could be mapped or visualised by region in charts.
Unions, think-tanks and political parties will also regularly collect data, as well as professional bodies and regulators, which release data quarterly, and some times monthly.
Many universities also carry out research in various fields, and through journals and publications, data journalists can track down interesting datasets.
While many data sources will offer machine-readable data to download in Excel, XML or CSV files formats, journalists will often still find or receive data in PDF format. PDF files are easy to view on most platforms, but extracting the data from such files so that it can be adapted to visualisations can be difficult, because data cannot be easily copied and pasted in a spreadsheet. Tabula is a free tool that allows journalists to upload text-based PDF files (not scanned documents), draw a box around the area of the data table needed, and the software will process tabular data in a spreadsheet-ready CSV format. To avoid this problem when requesting data via the Freedom of Information Act (FoI), it is recommended to request specifically that the data is shared in XLS or CSV format – although this might not always be received as such.
Extracting data from sources that do not offer an easily downloadable file format can be automated using Import.io (also free) instead of copy and pasting from web pages, which can be particularly time-consuming for journalists on a deadline. Import.io allows journalists to pull data from any website into a spreadsheet by selecting the rows and columns containing the information required.
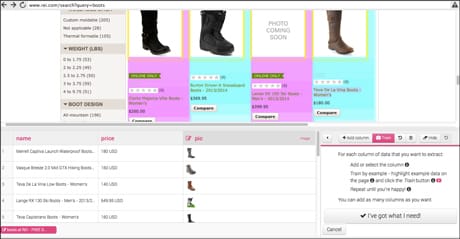
Building an extractor using Import.io
The application asks users to set up “connectors” for teaching the software where the data is on the page , between two to five examples, and set up column names. Import.io can then mix data from different websites into a single searchable database for comparison.
Google offers three free tools that can be applied to data journalism. Google Spreadsheets, as part of the Google Docs (free) suite allows journalists to open a dataset file and create simple charts, such as bar, line or pie charts, similar to the same process in Microsoft Excel, with several customisation options for colours, headings and scales.
For more complex tables and mapping them, Google Fusion Tables (also free) can produce zoomable maps with data overlays. For this, the journalist needs to import a dataset file, which includes location data for latitude and longitude. Fusion Tables then auto-detects the location data in the table and plots the data on a map. Additional data layers, such as regional borders for health, police or local authorities in KML format can be added .
With some practice and free tutorials , complex and comprehensive visualisations can be made with Google Fusion Tables, and the results can be embedded directly into online articles. Google Charts lets journalists create interactive charts, also embeddable onto online articles, with a vast gallery of designs available, from the standard pie, donut and bar charts, to geo (map-based) charts, timelines, bubble charts and treemaps. The chart colours are customisable, so they match the look and feel of the host website, and hovering over data points in the charts can display additional information tooltips for users.
When venturing into complex data visualisations, CartoDB (free for personal use) is a data-mapping tool that offers finer controls over the design of the mapped data and interactive pointers. The data maps generated with CartoDB can have a more distinctive style with existing presets or by creating a particular style, while the tool allows for multiple datasets to be merged easily to explore relations between multiple indicators.
Another data map visualisation tool is Tableau (free trial), which adds data layers on to maps, and can also display in the same interface different types of charts, such as bar charts below a map visualisation. GeoCommons (free) is an open repository of data and maps for the world, down to a local level, which offers a range of tools to visualise and analyse data on maps. It can also animate data through time and space to highlight trends. Datawrapper (free) is one of the tools for journalists to create interactive charts and graphs that can be embedded directly into online stories. It supports editing of the dataset within the software, which makes it easier to change a label for a set.
There used to be something here that couldn't be migrated - please contact us at info@journalism.co.uk if you'd like to see this updated!
A Datawrapper chart from a recent Journalism.co.uk article
Datawrapper also ensures that labels on charts and graphs do not overlap when data values are very close, and labels small slices outside a pie chart. These features make the resulting charts easier to read and superior to most charts created using spreadsheet software. Many Eyes (free), from IBM, an alternative tool for charts, creates varied types of visualisations: word trees, word and tag clouds, phrase nets, as well as bar charts, bubble charts, scatterplots, matrix charts and treemaps, as well as a range of map-based visualisations. With both Datawrapper and Many Eyes, it is very important to make sure the data fed into the tool is formatted cleanly, and keep in mind data uploaded into Many Eyes will be publicly available for anyone to see.
Most of the data visualisation tools, whether used to create charts or maps, allow journalists to customise the colour scheme for data points. Many publications’ graphics departments have strict guidelines on the colours used in illustrations, so obtaining from the equivalent colour codes for the web would help you match the title’s look and feel for visualisations.
If such a code is not readily available, journalists can customise their graphics with more distinctive colour schemes using Color Scheme Designer (free).
For maximum accessibility, the tool also provides colour scheme modes that keep in mind people who have various types of colour blindness, so that the effect of a chart or visualisation is not lost on them (Color Scheme Designer estimates that more than 85 per cent of the online-connected population has normal vision). Color Brewer (free) is a similar colour scheme tool, which is meant to help data journalists choose map colours, based on the number of classes in the map, and also the nature of the data. Color Brewer can also account for colour-blind safe schemes, as well as print-friendly colour variations.
Infographics are an increasingly popular way to display cherry-picked data points in easy-to-digest visualisations. The recent popularity of infographics has brought a range of tools for creating this type of data illustrations, with three in particular standing out for their design range and ease of creation. Infogr.am (from free) creates interactive infographics with charts. Multiple charts of various types, including column, pie, bubble and hierarchy can be used into one single data visualisation.
The interactive infographics are shared through the service’s website publicly. A paid pro account (£12) allows users to download the infographics as graphic files on a computer, and also share the animated interactive versions privately. For more graphic-led infographics, Piktochart (free trial, then £18 per month) can help create themed visualisations with a drag-and-drop visual interface, similarly to Easel.ly (free beta), which also has more than 100 templates to drag and drop elements and data into for infographics.
Taking some time to customise the elements of an infographic can make it stand out from many of the similar works using the same template.