Tool of the week for journalists: Piktochart
A free online app for creating infographics

– 1 min read
A free online app for creating infographics
This article was migrated from an old version of our website in 2025. As a result, it might have some low-quality images or non-functioning links - if there's any issues you'd like to see fixed, get in touch with us at info@journalism.co.uk.
A tool for creating infographics
This is a great tool for journalists with either limited time or limited Photoshop skills.
Piktochart provides a choice of templates, you then enter the information and tweak the size of the text, shapes and images to fit.
The best way to understand how it works and the simplicity and speed at which you can create an infographic is to click through to this video .
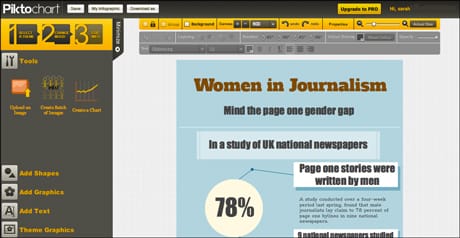
We have tested it out by creating an infographic based on a study by Women in Journalism. The data and story was reported by the WAN-IFRA Editors Weblog last October and we have simply used the information to test the Piktochart technology. It took less than 10 minutes to create an infographic, which is then downloaded as a png file.
Piktochart offers six templates that are free of charge, plus many more paid-for themes.
According to the Piktochart, more than 100,000 people have signed up to use the tool, which launched its beta version in December 2011 and released its first online infographics editing tools and themes last March.
The "infographics solution firm" is based in Penang, Malaysia and, according to the company, most of its users are from the US, Canada and Europe.