Why data journalism is 'the new scoop' for a Finnish news site
How Finland's Helsingin Sanomat uses templates for fast data journalism

– 3 min read
How Finland's Helsingin Sanomat uses templates for fast data journalism

This article was migrated from an old version of our website in 2025. As a result, it might have some low-quality images or non-functioning links - if there's any issues you'd like to see fixed, get in touch with us at info@journalism.co.uk.
Data journalism is considered "the new scoop" at Finnish news site Helsingin Sanomat .
Unlike text-based stories which are picked up by competitors and published quickly, visualisations are "content that cannot be copied", according to data journalist Esa Makinen .
Speaking at Digital Journalism Days , a conference in Warsaw organised by Polish title Gazeta Wyborcza, Makinen explained the many advantages of data journalism and talked through the approach.
Journalism.co.uk caught up with Makinen after the conference to find out more about the data desk at Helsingin Sanomat, a daily newspaper and website, which has 1.5 million readers and introduced a porous paywall in November. Readers can access five articles a week before being required to pay €10 a month for a subscription.
Helsingin Sanomat creates data visualisations for breaking news.
"The idea is that we make news apps very fast," Makinen said. "If there is a news event, we try to do something in two or three hours."
The news outlet creates data visualisations quickly by using a library of templates for graphs, maps and other interactives.
The templates are stored in an internal wiki so that journalists can add their own data and create a simple visualisation, or they can seek help from the three-person data desk.
The empty templates have "all the elements necessary for a news app – except the news app itself", Makinen said.
Journalists and those on the data desk at Helsingin Sanomat use Datawrapper almost every day. The site has a white label version of Datawrapper, an easy-to-use tool we have written about several times on Journalism.co.uk . The internal wiki accessible to all journalists at Helsingin Sanomat contains some basic templates for graphs.
The Finnish news outlet also uses Timeline JS, a tool created by the Knight Lab which allows you to add links, captions and dates into a spreadsheet template to create a timeline in a matter of minutes.
Here is an example of a timeline of Nokia , a Finnish company. Again, the data desk has set up timeline templates for fast turnarounds.
The news site also offers interactive maps to allow people to explore geographic data. This map shows 55,000 wolf locations . After attending one of Makinen's courses, journalist Heli Saavalainen explained she had 55,000 rows of data on wolf locations and wolf journeys.
Makinen plotted the data on a map and the result proved extremely popular. "Tens of thousands of people wanted to see where they were moving in their area," he said.
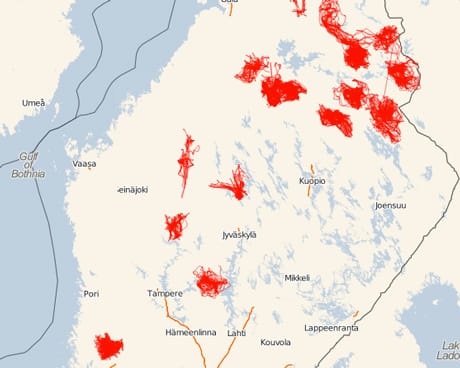
Mapping with wolves
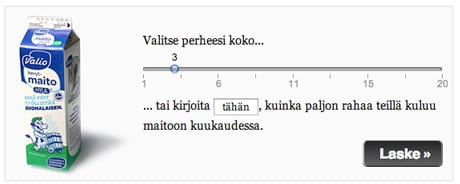
The data desk has also realised the value of allowing readers to put themselves within a story to see how it affects them. One example of such an interactive is this one on how much more Finnish people would pay for milk after a wholesale price increase.
"We can now put people in the centre of the story," Makinen explained.
Helsingin Sanomat has also used Google Forms. Ahead of an interview with Wikipedia founder Jimmy Wales, for example, they created a Google Form to crowdsource questions .
The news outlet also used Google Forms to find out how much people were paying to arrange mortgages, information that Finnish banks "were reluctant to provide" to the news organisation, Makinen said.
Around 5,000 people responded by filling in a form, providing the bank name, mortgage rate, additional fees, and postcode. The data desk was able to create a map and spot patterns and stories.
In addition to the daily visualisations and interactives reacting to breaking news events, the data desk has carried out some much larger projects, such as one focused on voting.
The voting advice application is much like the ' Who should I vote for? ' application published by the Telegraph in the run up to the 2010 general election in the UK.
The Helsingin Sanomat application asked people answer 30 questions which were matched against policy promises from the political parties. Or as Makinen described it, "it's like Match.com for politicians and voters".