App for journalists: Viz, an iPhone app for making charts
A new iOS app for creating visualisations which can then be shared via social media or saved as a jpeg

– 2 min read
A new iOS app for creating visualisations which can then be shared via social media or saved as a jpeg
This article was migrated from an old version of our website in 2025. As a result, it might have some low-quality images or non-functioning links - if there's any issues you'd like to see fixed, get in touch with us at info@journalism.co.uk.
iPhone, iPad
£1.49
A new app for creating quick charts on the fly
We all know that data is sometimes most clearly presented in the form of a chart or graph. This app, which released on Monday (5 August), enables you to quickly create quick visualisations on your iPhone.
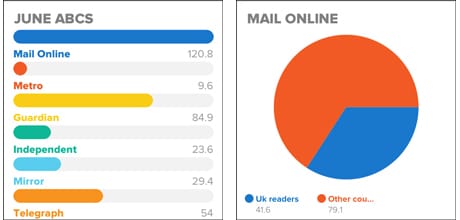
The results. Source of data: ABC
There are certain limitations. We created the test bar chart above by entering the ABC-audited figures for unique browsers to news sites. The app accepts a maximum of six lines of data, so we were unable to add the figures for some websites.
It also struggled to interpret large numbers, so we entered 120.8, representing the Mail Online's readership in millions, rather than the full figure of 120,829,031.
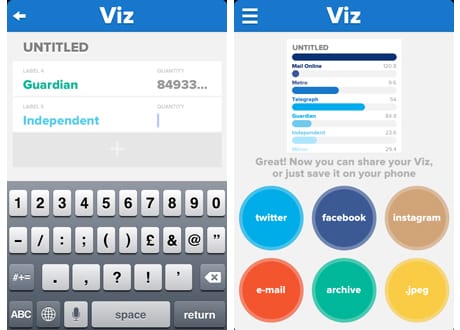
Once you have entered the data, selected the type of chart you want to create and picked a colour, you can then choose to share to Twitter, Facebook, Instagram, by email, or save it as a jpeg (as we did here in order to upload the graphic).
It is worth noting that unless you select to save your chart to the archive, the visualisation will not be saved and you will not be able to go back and edit it (which we discovered when we forgot to include a title).
Despite the limitations this is a great app and one journalists may find useful when presenting stories with numbers. It could be particularly effective for sharing stats story via Facebook.