From data crunching to storytelling: Lessons from six months of Urbs.London
Gary Rogers, editor-in-chief, explains how the website aimed to 'reinvent city news' using only open data
– 6 min read
Gary Rogers, editor-in-chief, explains how the website aimed to 'reinvent city news' using only open data

This article was migrated from an old version of our website in 2025. As a result, it might have some low-quality images or non-functioning links - if there's any issues you'd like to see fixed, get in touch with us at info@journalism.co.uk.
Over the past six months, journalist Gary Rogers and media strategist Alan Renwick have run the experimental website Urbs.London, a news operation which turns open data into news stories.
The site was created to enable the public to understand complex data spreadsheets and research provided freely to the public.
"What you see in an open data set is indeed open, but it is quite often hardly accessible to about 98 per cent of the population," said Rogers, speaking at the Hyperlocal Data Journalism conference in Preston on Friday.
"We decided that the best way to tell people a piece of information was to tell it as a story, so we decided to play with the idea of a data to narrative site."
The idea came from the pair both working within local media, and noting a shift in technological and distribution of news over the years, yet little change to the sources or production process of generating news.
"We came up with a challenge to ourselves at the start of the year to see could we reinvent city media – seeing if we could base the newsroom just on data," said Rogers.
"A lot of local journalism still involves individuals going out and chasing ambulances and trying to find stories from selected small numbers of sources, or perhaps feeding off press releases or information that they are told in a more constrained circumstance as financial pressures push down reporter numbers."
By replacing conventional sources and basing the newsroom purely on data, Rogers hoped to find a way to produce a scalable model that could result in stories cheap to generate, easy to produce and still extremely newsworthy.
Although the team initially had concerns they would inadvertently create a "not-the-news site", possibly running the risk of focusing on the information that other journalists thought was too "mundane" to report on, Urbs.London has gained a substantial following on Facebook of over 22,500 people, and has published over 300 articles.
By telling stories that were not based on single random events, explained Rogers, the team proved it is possible to tell the story of a city in a different way, through large numbers of occurrences and developing trends.
The pair chose to focus on London as they wanted to have a bigger audience to serve and a wider choice of information to analyse.
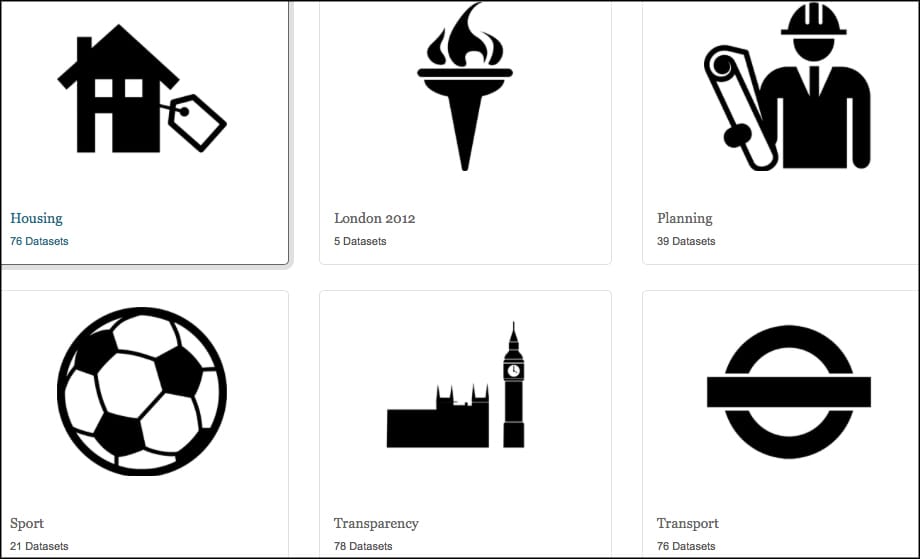
By using the London Datastore as their bedrock to gather content, which offers access to 600 data sets and growing, Rogers and Renwick hoped to make the work of the local authority more transparent to the city's residents.
"Essentially the task we had was to take the Excel spreadsheets, which are organised and sorted, and turn it into a narrative story that you could read on a tablet or a mobile phone," Rogers said.
Screenshot from London Datastore.
The company began experimenting with topics, by concentrating on some of the bigger themes around living in a city, such as housing, jobs, and transport.
"We found that doing the harder topics in the city has worked far more successfully than trying to do something light and frivolous." Rogers said.
"Now people expect to get their information from us – a piece where we used national insurance registration numbers on migrant workers across the capital is our most successful story to date!"
Their data analysis method was initially a challenge for Rogers and Renwick, attempting to tackle huge amounts of complex information and make them understandable to the average member of the public.
"We wanted to try out different depths and types of data to see what we could get out of them – some of them very well organised and easy to handle but some of them were complex and took lots of time," Rogers said.
"Once we started, we felt like we were on a treadmill and it was quite stressful as we were a news site so we had to publish!
"We were trying to think of a methodology around this to give us focus," he said.
The pair soon began to realise that rather than providing breaking news, their role may be better to provide enlightenment around the story of the day.
For example, they could pick a big topic such as housing, dig into property prices to provide a bedrock of information on what was really going on behind the scenes there, which could be then used on any day when a related story is running in the media.
In order to save time, Rogers and Renwick decided to create multiple stories out of single data sets, as they found a large group of numbers would give a cascade of stories that worked at various levels.
We were trying to think of a methodology around this to give us focus - Gary Rogers, Urbs.London
"If we were going to spend a lot of time digging into something, we wanted to get a lot of value out of that," said Rogers.
"You will get data and analyse the trends of, for example, crime across the capital, and then you will get out of that more intricate stories such as the theft of dogs. You can drill down and report on smaller areas, such as crime data in different boroughs."
The team at Urbs.London used this method across various subject areas, even analysing which tube line provides the most unreliable service in London.
"Although there are always lots of individual pieces of content to do, once you have done a few, you are almost on a production line and you could sweep through the data.
"The information was easier to handle than we thought it would be – the positive thing about the early experience was that with just a basic level of Excel skill, we could excavate just a few stories to start with," Rogers said.
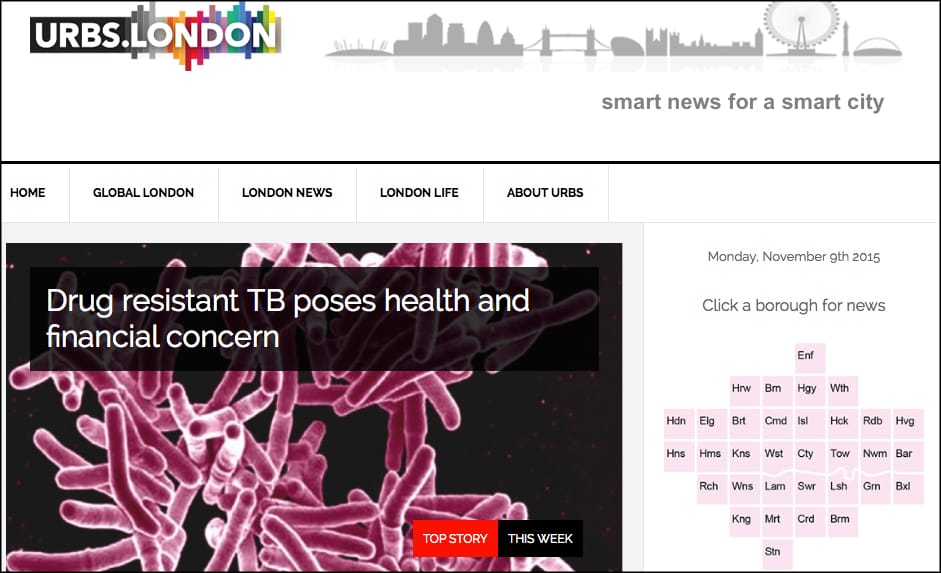
Screenshot from Urbs.London
In order to save time analysing data, Rogers explained how the team would apprehend the value and content of the data, to ensure they would not spend time looking into issues just to find there was nothing particularly newsworthy there.
"We get this data set and have a drill around to develop a hypothesis of what might be in there – just to try and direct us, so we have the flexibility to change tack quite quickly when we see that is not the case, and to focus on answering a simple question – 'what is the story here?'" he said.
"You have to have a journalistic nose when working with data for sniffing something and thinking 'that smells a bit odd to me' and saying 'I think we should investigate that more'."
In order to make the data as simplified as possible, all stories on Urbs.London are under 400 words, and link back to the original data for verification and authenticity.
"We were trying to build an interlocking picture of little stories which gave you the bigger whole," said Rogers.
"One story wouldn't do it, but if you read four of them, you would get a bigger picture, so it is about linking and connecting all the way through.
"It sounds ambitious, but if you start with small building blocks, the Lego clicks together and you begin to get insights from looking at one thing to the other."
Additionally, Rogers feels that infographics are unnecessary and actually take away the simplicity of the story which they are trying to create.
"What we didn't want to do was get involved in complex infographics which take time to interpret, because I think one of the problems in visualising data stories is that those visualisations themselves require levels of interpretations, and that seems like a barrier to understanding.
"So we were back to the simplest way to tell a story... write it with words," Rogers said.
"If I have taken away anything from the past six months, it is that there is an enormous amount of information that seems to be largely untapped and that people just aren't looking at it and using it," he added.
"I don't know if that's because of a failing by journalists, whether collectively as a profession we have got used to being spoon-fed and not going back to the source, or whether the idea of digital source seems so difficult for us to cope with, but there were lots of things that were easily available and worthy of enquiry that other media was not touching.
"There are a lot of different avenues to pursue what we've learned as an open city, data to news narrative organisation, but we are hoping that one of those can mean that this experiment can turn into some form of sustainable business."

