WATCH: How the data team at the FT is moving forward as audiences go mobile
The publisher's data specialists are looking to improve how journalists at the organisation tell stories with data and visuals
– 2 min read
The publisher's data specialists are looking to improve how journalists at the organisation tell stories with data and visuals
This article was migrated from an old version of our website in 2025. As a result, it might have some low-quality images or non-functioning links - if there's any issues you'd like to see fixed, get in touch with us at info@journalism.co.uk.
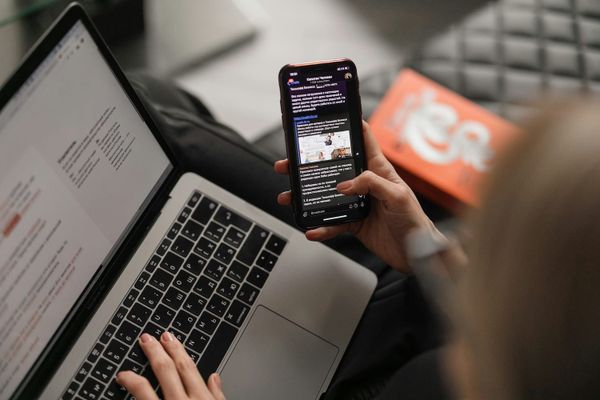
Journalists at The Financial Times are re-evaluating their approach to data driven stories to make graphics work on mobile.
Martin Stabe, head of interactive news at The Financial Times, manages a team of designers, developers and data journalists who are working on new forms of online storytelling for primarily data-driven projects, from immersive multimedia stories to data visuliation-based news applications.
"Some projects are much more interactive, where the user has to drill into the story and explore the data themselves, but other things are a lot more explanatory where we lay data out in a much more linear form – it depends on the data available and the stories that we want to tell," said Stabe.
His team is moving away from complex interactive data, favouring simpler, self-explanatory, annotated graphics as audiences increasingly consume news on their mobile devices.
"There is sometimes a sense that interactivity is a good thing and it makes things more interesting, but that is often a false assumption – interactivity is quite hard for people to use, so we want to use it sparingly in those cases where it is really required," said Stabe.
Last year the publication also employed Alan Smith, its first data visulisation editor, a new role designed to draw graphics, data and interactives together in order to help unite the data team for a more efficient news production process.
"Traditionally in the newsroom, you have small little teams with no overlaps, but we want to use modern technology, confidence with data, design and journalism skills, and bring that all together so that we have a joined up, more modern style of journalism," said Smith.
By training staff at the news organisation to work with data and recognise how it can be best used to tell stories, The Financial Times is hoping the data team will integrate with the rest of the newsroom and turn data and graphics into a core part of the publisher's storytelling technique.
"You've got to be wary that by having people who are specialists in data and specialists in graphics, you don't absolve responsibility from anyone else in the newsroom to get involved in those areas," said Smith.
"I would like to think of the graphics and data professionals that we have as journalists whose job it is to interact with other journalists as much as it is to focus on their own specialisms, so to evangelise how we can use data and graphics as part of our core storytelling, rather than just running a little kiosk in the corner of the newsroom that is producing graphics and data to order.
"Getting everyone else in the newsroom to realise when data should be playing a part in their story, when they should be spotting opportunities for using graphics in their stories, is really important," he said.
Additionally, the FT is looking to improve their workflows when producing stories for different platforms in a bid to increase efficiency and save time.
"We have very different workflows for print than we do for online, interactive, or social media, so the real challenge for us right now is to bring the workflow much closer together, so that irrespective of what platform we are producing content for, we can do it in a single efficient manner," said Smith.
"We are trying to integrate our production system at the moment, and we are using a lot of web technology to do things like drive print graphics, or spinning out social media styled versions of graphics at the same time as creating an interactive or a static image for online – so that's a real challenge for us online right now."