"We find ourselves in this perfect storm where suddenly journalists, everybody, is paying attention to data and the ability to collect data and create new data. It's getting easier and people are doing it more often."
Andrew Hill is a senior scientist at Vizzuality, the organisation behind open source mapping tool CartoDB, and is particularly effusive about the possibilities that the mapping of data holds for storytelling.
"We're really excited to get the opportunity to experiment," he told Journalism.co.uk, "and give journalists the opportunity to experiment with maps in the way that stories are being told right now."
In January, Vizzuality received a $35,000 grant through the Knight Prototype fund to develop its work with data; test the possibilities for how data visualisations can tell stories; and explore how maps and text may interact on the page.

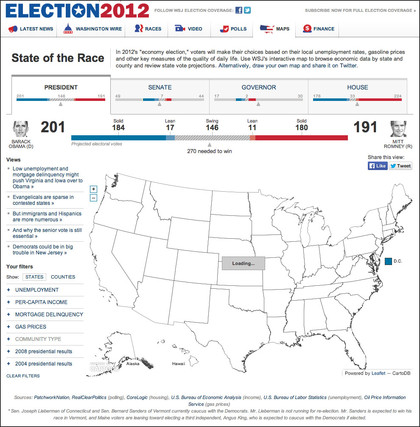
Screenshot from WSJ.com of a CartoDB map used to tell the story of the US elections in 2012
The project is still in an early stage as Hill consults with journalists and thinks about "the culture of mapping," but he has a clear idea of where it is heading.
"It's an open source Javascript library that would let you integrate elements of a web page with maps," explained Hill. "So, as you move, it displays or moves to different locations, or moves and changes the way the map styles.
"But we're really going to ramp up over the next few months and build it into something that anyone can get into and make more interesting maps that are coupled with stories."
The Knight-funded project is "sort of independent" of CartoDB, said Hill, but keeps the open source philosophy that is central to how Vizzuality think about their work. As a company with a history building tools and platforms for government agencies and scientists, working in conservation or biodiversity, the idea of open knowledge and community is strongly felt.
For this reason, Vizzuality will continue to develop on CartoDB to make "all the existing pieces work faster and better and easier," he said. Users will have the option to make their data private, unlike the public default at present, or create team accounts for news desks, schools or publications.
"I guess the core mission for CartoDB is to make mapping easier," Hill said, "so we like to say we're democratising maps online but with that comes a need for education.
"We've been trying to make it easier to find the resources and ways to find the skills to make the maps online so we started something called the map academy."

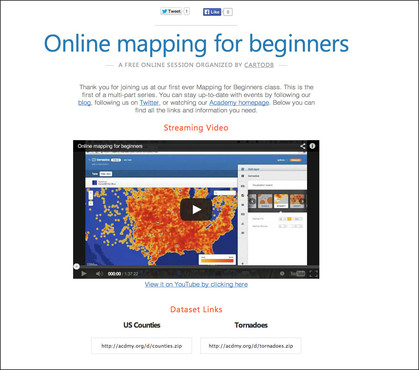
Screenshot from Map Academy
With the map academy, students are thrown in at the deep end, building maps from scratch and "getting pretty far" before the process is deconstructed and analysed.
"The first class in December had around 4,000 people signed in for the live stream of that," he said. "We'll continue doing that but the long term vision for CartoDB is in building the community and ecosystem of developers and mapping knowledge."
That plan is still conceptual at the moment, said Hill, but the speed at which journalists, developers and the wider public are adopting and acclimatising to the wealth of data that is available means data stories are easier to find, and easier to tell.
"It's a lot easier to make data visualisations and map-based visualisations than it was a year or two years ago on the web," he said. "Where it's going to be in a year or two years from now is still a question for the makers and the consumers.
"But this is our opportunity to explore that with some of the people that are on the leading edge of how to consume information on the web in a way that's meaning full and impactful."
Free daily newsletter
If you like our news and feature articles, you can sign up to receive our free daily (Mon-Fri) email newsletter (mobile friendly).


