This article was migrated from an old version of our website in 2025. As a result, it might have some low-quality images or non-functioning links - if there's any issues you'd like to see fixed, get in touch with us at info@journalism.co.uk.
Data visualisation platform Visual.ly will launch a series of new tools, which will allow journalists to create infographics, by the end of this year. Visual.ly already offers a "sample" of free tools for creating infographics and is working on providing a series of visualisation templates where journalists can upload data or bring it in from an API.
The platform launched last year with the goal "to create a community to bring together all the great designers, developers, analysts and journalists and have them showcase their work".
There is currently the option of creating a visualisation of "the life of a hashtag" simply by entering a hashtag. Visual.ly then delivers a narrative (see this one we created using the news:rewired hashtag #newsrw). There is another create tool that allows you to visualise your Facebook page (see the Journalism.co.uk page visualisation ).
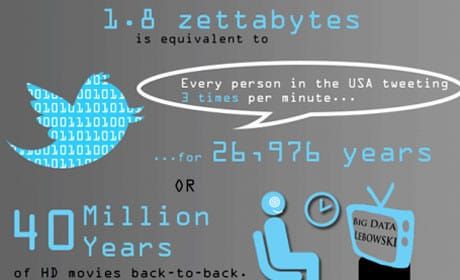
Since its launch a year ago more than 11,000 custom built visualisations have also been created by Visual.ly's community of 21,000 designers. Visualisations including the weird world of celebrity divorce, the iPhone turning five , the Tour de France , Wimbledon , the Olympics , or how to cat proof your computer. Journalism.co.uk met up with Stew Langille, chief executive of Visual.ly, when he travelled from his base in San Francisco to give a presentation on " rethinking storytelling " at the Guardian Activate Summit.
He explained how the team started by testing ways of "bringing commissioners together and have them create data visualisations: static infographics, video, interactive dashboards".
Visual.ly started by connecting people to "test where the gaps are in the tools and the software that's needed".
Langille and team found that where animators had a range of tools at their fingertips, that was not the case for those who wanted to create infographics.
"In data visualisation none of that existed so we were really starting from scratch."
Visual.ly therefore started to create "tools to help facilitate that process", that people could use by adding a data set or using an API .
The team launched the hashtag tool, Facebook page tool (see above), and a number of others . "What we launched to the public was really just a sample to give people some awareness of what we are working on," Langille said.
Visual.ly has privately "launched an alpha product to allow users to create their own charts and graphs and upload via Excel".
They have also been trying out the graphics with testers, including Cicso, Unicef, the World Bank, the Huffington Post, CNN, and the Economist.
Visual.ly has found issues between the lack of a standard in Excel files, Langille explained, adding that for this reason Visual.ly has therefore opted not to launch this as its first product and "to focus on understanding data feeds and look at trying it out with a few individuals and companies before a general release".
"We are now heads down into building and developing more of the tools," he added.
"The most difficult part of what we do, which is providing the value, is allowing people when they come in with their data to hook that data up into a reusable format."
Templates
Visual.ly is working on a series of templates and by the end of the year users will be able to "plug data into those templates".
Each template has elements that Visual.ly calls "nuggets", a graphic with underlying data. Charts, maps and glyphs are all nuggets. And as the community creates more nuggets, Visual.ly's "internal library grows and grows".
One thing Visual.ly is aiming to do is quality control. "We don't want to have people putting random 'nuggets' together to create what looks like a bunch of charts. There's not really a narrative to that. What we want to do is reinforce storytelling as we see ourselves as storytellers.
"Everyone at the organisation has to be a good storyteller to come into the company."
'A huge free component'
Those who want to use the free data visualisation tools will opt for the templates, those with pro accounts will have some flexibility and a designer can then use a template as a guide.
"They can export to Adobe Illustrator, design a custom design on top of it, import that from Illustrator (as an svg file) into our platform and then we automatically hook back up that data to that svg."
Visual.ly has worked out how to automate relatively simple designs and relatively simple data sets but they are aware that there needs to be a "service component" as "you can't automate everything".
That component is the 21,000-strong community of designers, 200 of whom are "pegged as the best of breed", plus data analysts and data scientists, such as some with day jobs at Nasa and at MIT.
"If you have a data set and you don't understand it you can drop it on somebody in the community and that person will take that data and turn it into a usable format for our platform," Langille explained.
But as well as providing pro accounts, aimed at commercial companies wanting to create visualisations for brochures, websites and presentations, Langille promises a "huge free component".
The "nugget" concept will "allow you to have certain data sets that you can import yourself, have a self-service interface for those data sets, and have a library of nuggets you can put into templates and you can publish".
This is currently being tested with partners and will be released in beta over the summer.
Asked when we can expect a public release, Langille said: "I'd say conservatively before the end of the year."
He added that Visual.ly keen to wait until they are confident in the create tools. "It's taken time as we wanted to get it right."