Watch: Visual journalism and what makes a good infographic
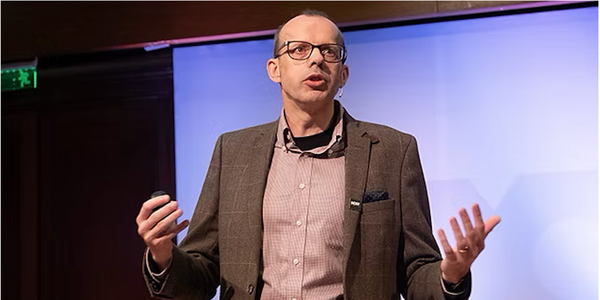
Freelance designer and trainer Lulu Pinney shared her tips on telling visual stories as part of last week's digital journalism conference news:rewired
– 1 min read
Freelance designer and trainer Lulu Pinney shared her tips on telling visual stories as part of last week's digital journalism conference news:rewired
This article was migrated from an old version of our website in 2025. As a result, it might have some low-quality images or non-functioning links - if there's any issues you'd like to see fixed, get in touch with us at info@journalism.co.uk.
Visuals are vital for processing information and, online, there are far more avenues to pursue in terms of making a story understandable and digestible with graphics.
At last week's news:rewired digital journalism conference, freelance designer and trainer Lulu Pinney shared her advice and experience in making infographics for news organisations and outlined some key pointers in the video below.
Catch up on all the conference coverage on the news:rewired website .