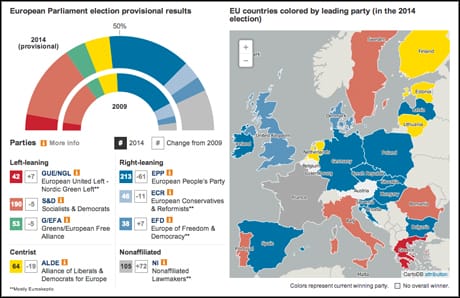
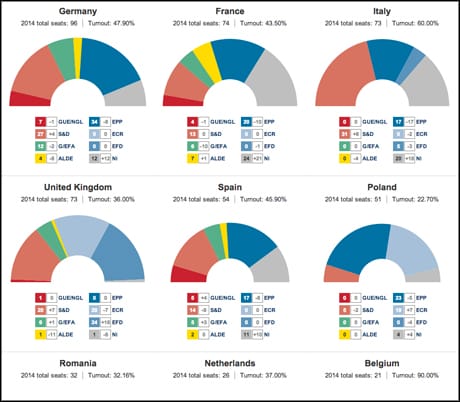
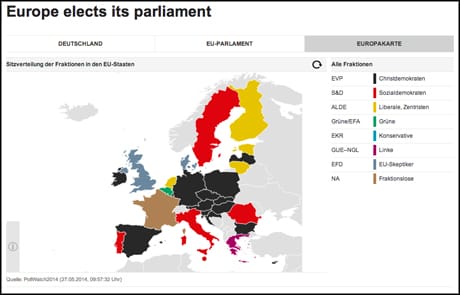
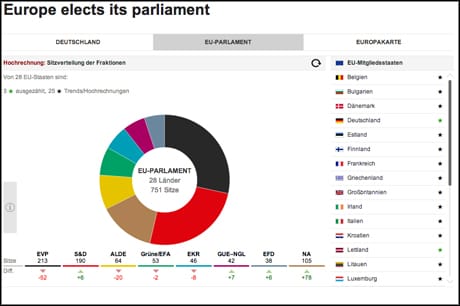
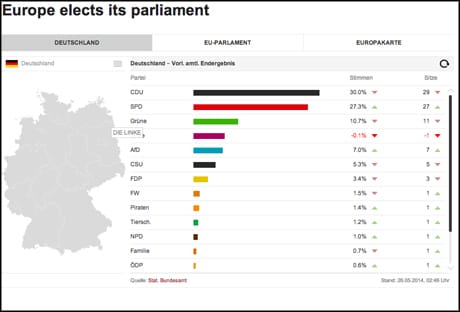
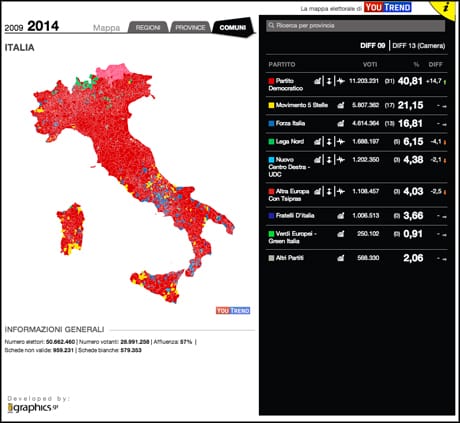
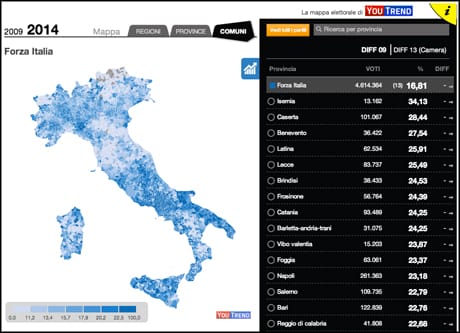
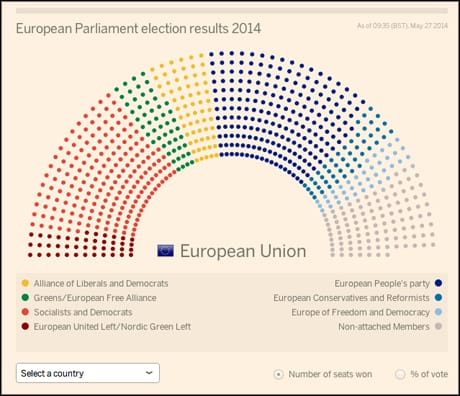
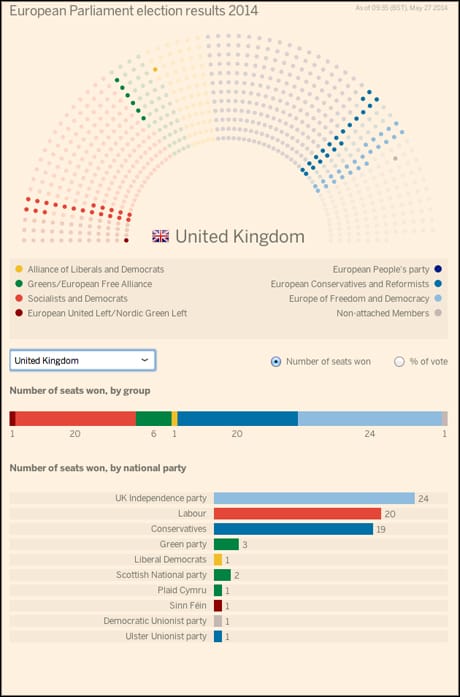
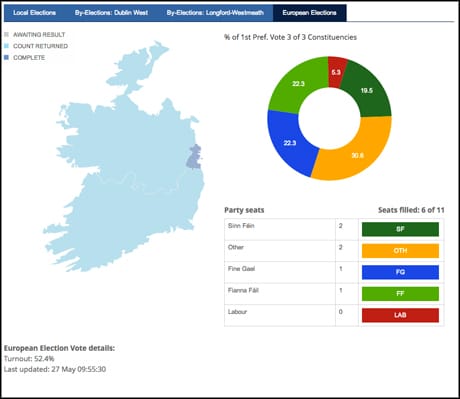
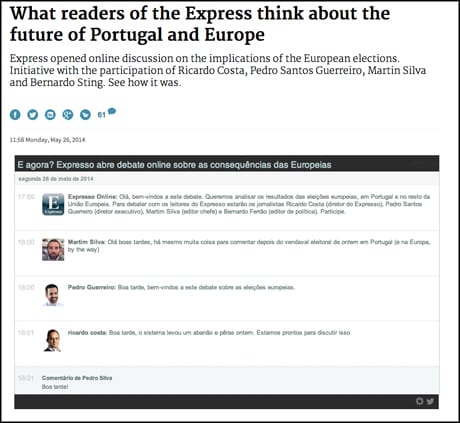
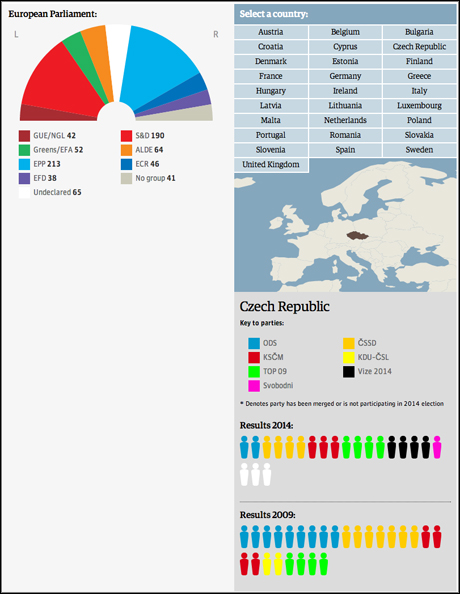
european flags
Credit: By tristam sparks on Flickr. Some Rights Reserved.

The headlines covering the 2014 European elections have been largely about the rise of Eurosceptic parties – due to a voting public disaffected by the political process, angry at EU involvement in national affairs, or both, depending on where you get your news.

It was also an opportunity for news organisations to tell a complex and potentially dreary story in a visual and engaging way, so here are seven pieces of coverage that caught our eye from news outlets across Europe.

  • The Wall Street Journal

The Wall Street Journal gave detailed coverage of the European Elections, including maps, charts for the Europe-wide results and breakdowns of how each country had voted, including information on how the various MEPs formed parties in Europe.

WSJ EE
Screenshot from WSJ.com

Individual country results could be organised by population, alphabetical order, voter participation and the number of "non-affiliated lawmakers" – elected MEPs from parties that did not have attachments to other parties during the previous parliament.

WSJ EE2
Screenshot from WSJ.com

The Journal also provided videos on "how the election works" and "who holds the power", while making use of a set of charts and graphs provided by the European Parliament that were freely embeddable on any website.

  • The Guardian

gdn ee

Screenshot from theGuardian.com


The Guardian offered a more compact version of a similar theme: a semi circle to show the proportion of representatives across the political spectrum with the opportunity for readers to see how each country had voted and how many MEPs were elected from each party.

Behind the scenes, the Guardian data team built some spreadsheet-based calculators which "worked out how votes turn into seats in the European elections", said James Ball, special projects editor at the Guardian US who was working from the Guardian's UK office during the elections.

"That meant we could declare seats in each region 30 seconds early," Ball told Journalism.co.uk via email. But a "more useful" outcome was in analysing the results as they came in, determining by how many votes the Liberal Democrats, for example, had held or lost seats, or tracking how "UKIP lookalike party" An Independence from Europe had cost UKIP two seats, he said.

"Having that ability to model different scenarios and check out votes/seats/oddities in real time lets you add depth to the reporting across social media and the live blogs," Ball said, "but also to pass on tips and trends to the news desk and politics desk."

  • Zeit Online

German ee3
Screenshot from Zeit.de

German weekly Die Zeit built three visualisations in one for their coverage of the European elections, to show how Germany had voted, the make-up of the new European parliament and the breakdown of votes in each country.

The interactive map of Europe, above, included pop-out windows detailing the number of elected MEPs from each national party of member states, a subject that could be seen in more detail in the doughnut chart of elected MEPs, below.

german ee2
Screenshot from Zeit.de

The outlet also provided a regional breakdown of how the German electorate had voted and, like many outlets, a live blog on election day itself.

German ee1
Screenshot from Zeit.de

  • La Stampa

la stampa ee
Screenshot from LaStampa.it

La Stampa's map of Italy, built by YouTrend, gave an in-depth study of how different regions, provinces and local constituencies had voted in the European elections.

la stampa ee shading
Screenshot from LaStampa.it

Readers could compare results from 2009, see how strongly different constituencies had voted for different parties based on the colour saturation and zoom into regions and provinces to get a more detailed look at how their compatriots had voted.

  • The Financial Times

ft european elections 1
Screenshot from FT.com

Instead of a map, the Financial Times presented results in the hemicycle of the parliamentary debating chamber, with coloured dots depicting elected MEPs and their political affiliation.

ft european elections 2
Screenshot from FT.com

Readers were also able to select countries from a drop-down menu to see how the European Parliament is made up of representatives from national parties in the member states.

  • RTE News

rte euro elections
Screenshot from RTE.ie

Irish broadcaster RTE opted for a map of the Emerald Isle to show results of the four elections taking place on Friday.

The Irish electorate had two by-elections on top of the local and European elections to vote in, and RTE gave their readers the opportunity to explore how different constituencies had voted with a doughnut graph showing the make-up of votes in each one.

  • Expresso

expresso eu debate
Screenshot from Expresso.sapo.pt

Rather than build an interactive map or visualisation of results like many other outlets, Portuguese weekly Expresso invited readers to take part in an online discussion with members of its senior staff.

Ricardo Costa, the paper's director, used CoveritLive to engage with readers on the future of Portugal and Europe alongside editor-in-chief Martin Silva, chief executive Pedro Santos Guerreiro and policy editor Sting Bernardo.

This is by no means a definitive list, if any other news outlets caught your eye in terms of the election coverage please feel free to highlight them in the comments box below.

Update: this article has been updated with quotes from the Guardian's James Ball

Free daily newsletter

If you like our news and feature articles, you can sign up to receive our free daily (Mon-Fri) email newsletter (mobile friendly).