The BBC is to launch daily infographics distributed on social media as part of continued experimentation into reaching audiences on new platforms in innovative ways.
From 19 May, two infographics per day on current news topics will be shared on Facebook, Twitter and Pinterest before they are collected in a weekly round up on the BBC website.
"What we're trying to deliver is a really salient, interesting nugget on a big story," Amanda Farnsworth, editor of visual journalism at BBC News, told Journalism.co.uk.
Sometimes it may be around a serious news piece like Syria or Ukraine, she said, but it could also be something that catches the imagination of the wider populace.Visual journalism meets three audience challenges: distinctiveness; a modern and lively way to treat news stories; and an aid to understandingAmanda Farnsworth, BBC News
"A lot of people are on mobile and coming [to the BBC] via social," she said, "so how do we service that part of the audience as well as on the traditional platforms?"
The daily infographic is "part of the stable" of social media-focused experiments in recent months, said Farnsworth, including Instafax, BBC Trending and experiments with WhatsApp and WeChat in the Indian elections.
Farnsworth announced the new project at the Reuters Institute conference on Big Data for Media, in London today.
Producing infographics each day is part of the ongoing efforts from the BBC news visual journalism unit in meeting key audience challenges, she said.
"Visual journalism meets three audience challenges," said Farnsworth, "distinctiveness; a modern and lively way to treat news stories; and an aid to understanding."
The infographics will "tick all the boxes", she said, sharing three other examples where the BBC has previously met these challenges.
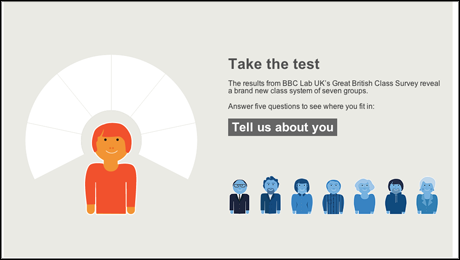
The Great British Class Calculator

Screen shot of The Great British Class Calculator on the BBC website
The Great British Class Calculator was one of the most visited interactives the BBC has ever produced, Farnsworth said, precisely because it ticked all of the boxes in what the audience is subconsciously attracted to online.
The interactive was based on extensive research from the BBC Lab UK's Great British Class Survey, analysed by professors at the London School of Economics and the universities of York and Manchester.
The level of detail in the 'class calculator' "made it completely personally relevant to every user that engaged with it," she said, "and it got shared like crazy," leading to a number of other "personal relevance data projects" from the BBC.
The success of the 'class calculator' was so strong that BBC correspondent Nick Higham took an iPad with the page loaded to the streets around Covent Garden to ask people their opinion for a television segment.
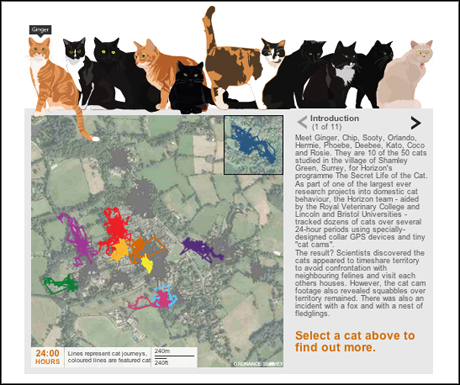
The secret life of the cat

Screenshot from the Secret life of the cat
The Secret life of the cat was a BBC Two Horizon special that performed particularly well online, said Farnsworth, in no small part because "cats rule the internet".
The online version used extra footage from the television episode that allowed the audience to track the path of the cats followed for the programme.
Again, this fulfilled the criteria by telling a fun story in a new way, she said, as well as repurposing unused material from broadcast to online.
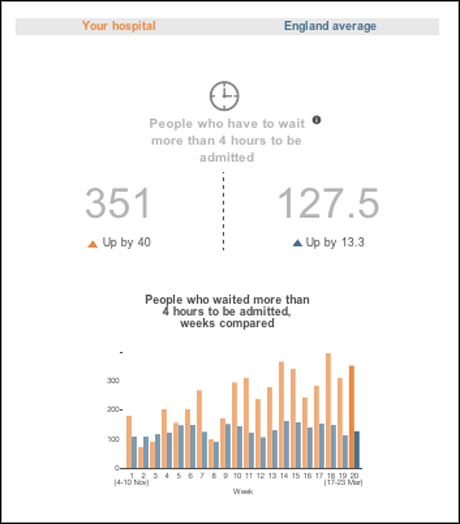
NHS Winter

Screenshot from NHS Winter
The BBC project NHS Winter was the final example Farnsworth shared, as an interactive data project which very much fulfilled the criteria of "aiding understanding" in terms of public service.
The team behind NHS Winter gathered datasets from hospitals across the UK to create an interactive that asked users to enter their postcode to see how their local hospital performed compared to the national average over winter.
Such an undertaking took time, but Farnsworth said it was advisable to "have a week or two to research where you explore the data before committing resources to the project".
Free daily newsletter
If you like our news and feature articles, you can sign up to receive our free daily (Mon-Fri) email newsletter (mobile friendly).
Related articles
- Rachel Duffy, senior social media editor of The Telegraph, on using Reddit for news
- 10 creative ways to interview celebrities and experts
- LinkedIn newsletters: are they what they are cracked up to be?
- The summer 2024 journalism grants roundup
- 200 women speakers you need at your next journalism event to avoid all-male panels


