7 data viz tools for covering the UK general election
A selection of (mostly free) data visualisation tools and apps for journalists covering the upcoming UK general election
– 4 min read
A selection of (mostly free) data visualisation tools and apps for journalists covering the upcoming UK general election

This article was migrated from an old version of our website in 2025. As a result, it might have some low-quality images or non-functioning links - if there's any issues you'd like to see fixed, get in touch with us at info@journalism.co.uk.
Journalists have never had more data to work with than we do today, and there's no shortage of online tools and apps that can help analyse and visualise this data.
Many of them are free to use, or work on a freemium model where certain features can be accessed at no cost, so reporters have plenty of options for making the most of the data in their stories.
And when better to test some of these tools than during election time? Here are seven (mostly) free data visualisation tools to explore next time poll results or surveys land in your inbox. Venngage If you want to turn polling data into engaging infographics, look no further than Venngage.
This free platform allows you to incorporate graphs and charts by copying and pasting data from an Excel or Google spreadsheet. Alternatively you can enter in a Google Sheet URL.
And because it's an infographics editor, you can customise the way your data is displayed using maps, pictograms and images. Some features do, however, require a premium account, from $19 (£12.86) a month.
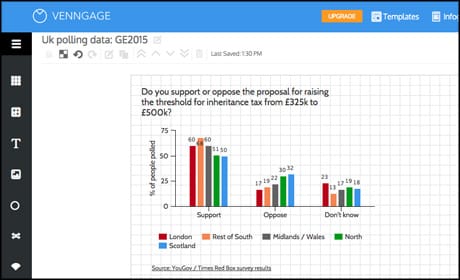
Screenshot from Venngage.com
As the name suggests, this free platform puts design first. Users can choose from a template in the community gallery or design their own before adding data by copying and pasting or uploading a CSV file.
While the basic account is free, the pro version includes extra features such as interactive web embeds and vector PDFs for $14.99 (£10.14) a month.
Screenshot from Datavisual Tableau Public Suitable for individual journalists, freelancers and smaller news outlets, Tableau Public is the lightweight (and free) version of Tableau Desktop.
Although it takes a bit more practice than perhaps some of the other tools featured here, the range of templates and visualisation options is worth it. See our recent 'how to' guide on telling data-driven stories with Tableau .
Screenshot from Tableau Public Perspective This free app for iOS enables you to produce animated graphs and charts in a presentation format. Note that you can only create visualisations on iPad, although you can view and play them on iPhone.
Despite the smaller screen size, the app produces high quality visualisations which stand up to display on larger screen too. You can create one free story before you need to upgrade to a pro subscription for £39.99 a year.
Screenshot from Pixxa.com Plotly With Plotly, users can import data from a variety of sources including Dropbox or Google Drive, and then 'make a plot' by choosing their preferred format.
Options include line plots, bar charts, scatter plots and heat maps, and the help section of the site features a number of step-by-step tutorials.
You can also collaborate on data visualisations in Plotly, and embed the finished plots once you're happy with the result. The free version allows you to create 10 private files and unlimited public ones.
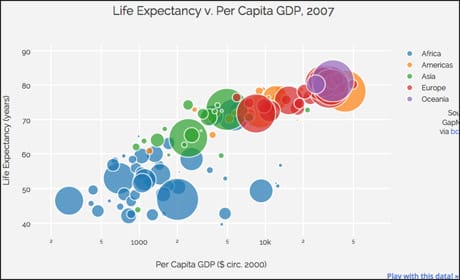
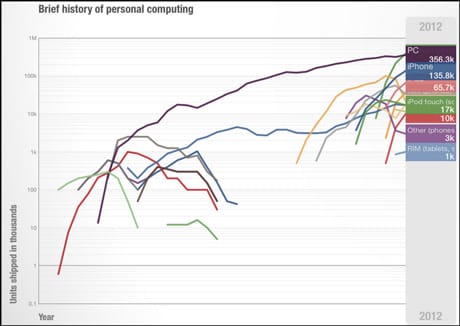
Bubble chart, screenshot from Plotly. Silk If you have more data sets on the same subject, you can use this data to build a story with Silk.
The data storytelling platform allows you to create a stand-alone site, called a 'Silk', for each topic you're exploring, and put together data visualisations and text to tell the story.
Each individual visualisation is then shareable and can be embedded in other articles. Check out this data analysis of women's portrayal in films to get an idea of what a 'Silk' looks like.
Silk Public is free to use, and Silk for Teams is currently free for a limited time, allowing you to keep your 'Silks' private as well.
Screenshot from Silk. Chartbuilder Chartbuilder from Quartz is an open-source tool you can use to create line graphs, bar grids or scatter plots.
You can either use the version hosted by Quartz for quick charts, or download Chartbuilder from GitHub for more options to customise your chart.
In the hosted version, you can download your chart as an image or copy the HTML table.
A sample graph created with Chartbuilder.