Credit: Screenshot: Public Interest Journalism Initiative's Australian Newsroom Mapping Project
This article was migrated from an old version of our website in 2025. As a result, it might have some low-quality images or non-functioning links - if there's any issues you'd like to see fixed, get in touch with us at info@journalism.co.uk.
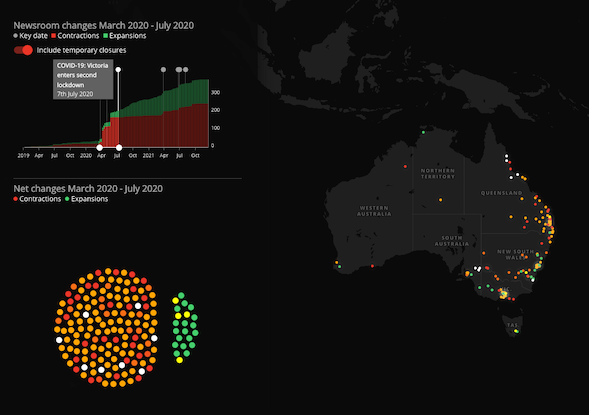
An Australian news initiative has been mapping expansions, contractions and mergers in the country's news industry.
The Public Interest Journalism Initiative (PIJI) is a think tank focusing on a sustainable future for public interest journalism in Australia. In April 2020, it started to track changes in news production. From there, it built a database and gathered data on the market from its own database and from publicly available information from the country’s biggest media companies and industry bodies.
The team worked through others pockets of data, like registered companies databases, incomplete third-party databases, and direct communication with media operators. It also crowdsourced more than 2,000 responses, particularly on very small, print-only newspapers in rural and regional Australia.
The culmination of all this work is the Australian Newsroom Mapping Project, which is in a beta version for the next two months. The project is maintained by Gary Dickson, research and projects manager, PIJI, and the visualisation was developed by Harley Alexander. There is a public call-out for further comment and feedback, with the aim to update the mapping project in early February 2022. In other words, the data is not yet complete.
The visualisation currently tracks net changes across Australia from January 2019 to December 2021. It quite clearly shows where news deserts are forming, which areas have been hit hardest by closures, and conversely, where expansions have taken place. You can also slide the scale to pinpoint how much has changed between key events, like when covid-19 first forced businesses to close or the second lockdown.
Screenshot: Public Interest Journalism Initiative's Australian Newsroom Mapping Project
More stages will be rolled out over the next six to nine months, including national news producers, broadcast news producers and information on media corporate structures.
Journalism.co.uk caught up with Dickson and the CEO Anna Draffin to talk about the project. They said they took inspiration from UNC US News Deserts project and Montclair University News Ecosystems project. Both projects approach the data in different ways but are visually similar: a choropleth map (coloured or patterned thematic map) subdivided into political units, each coloured according to the density of the data.
This project adapts those models for the Australian context so that users can quickly access and understand the findings for their local area in relation to others nearby. There are limitations to this approach. For example, this project provides a very broad guide to where news is, without much context about what the news is covering. Future stages of research on these projects will seek to address these limitations.
What can other local news initiatives take from this example?
Thoroughly review and understand the data sources and fields to be captured, and build a detailed ruleset around those data definitions. PIJI might be tracking expansions and contractions broadly, but within that, there are subcategories that feed into that data: new masthead, station or website; newsroom opened; increase in service; new print edition; merger; end of print edition; decrease in service; newsroom closure; masthead or station closure.
Test the process in a limited way before you start the project. This approach will enable data gathering in a consistent and efficient way, while also providing guidance for adjustments when unique cases or constraints inevitably arise because of available data and/or time.
Broad stakeholder engagement is also essential to avoid partial and/or out-of-date data sources. At a project delivery level, this engagement will help bring together any affected parties. The update, correction and release of revised data can be a common goal.
Communicate regularly with government departments, industry and community bodies and universities to create project buy-in and encourage wide, considered analysis of the data.