Detective.io launches publicly as investigative tool
Now publicly available, Detective.io is open source and can help users track connections through datasets to uncover corruption, crime and wrongdoing
– 3 min read
Now publicly available, Detective.io is open source and can help users track connections through datasets to uncover corruption, crime and wrongdoing

This article was migrated from an old version of our website in 2025. As a result, it might have some low-quality images or non-functioning links - if there's any issues you'd like to see fixed, get in touch with us at info@journalism.co.uk.
Investigative journalism is often about networks. Shady government deals for a country's natural resources, corporate profits filtered through myriad subsidiary firms, organised crime bosses laundering money through front businesses and family ties – all can be traced through a web of connections.
Now Journalism++ , a pan-European collaboration of journalistic innovators, has publicly launched Detective.io as an open-source tool to help journalists map and analyse such networks.
"The idea is to make network analysis easy for anyone," Nicolas Kayser-Bril, co-founder and chief executive of Journalism++, told Journalism.co.uk, "especially for anyone working in a team."
Once signed up for a free account, Detective.io users can plot the network before inputting the specific data points by uploading a CSV file. Alternatively, for those with small amounts of data or a lot of free time, there is an option to add data manually.
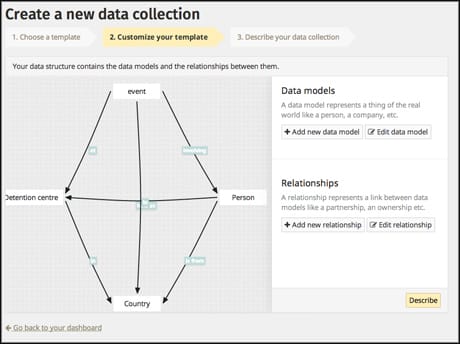
Plotting the connections between data points from The Migrant Files in Detective.io
For a project like the award-winning Migrant Files, which investigated the deaths of migrants across the European Union, those data points are countries, detention centres, migrants and "events" – more often than not the sinking of a boat crossing the Mediterranean, or a death in custody.
Detective.io then traces connections between elements in the data to build a visualisation.
"On a broader scale we hope that it will be used for data repositories and long term databases," continued Kayser-Bril, "like The Great Rip-Off map , like what we're doing for The Migrants Files because these are the kind of projects where it's really useful to see data in the network rather than in the table.
"We also launched the Belarus network which was an investigation into the Belarusian elite."
Visualisations for The Great Rip-Off map and The Migrant Files were both custom-made by Journalism++ for the respective publications, but Detective.io offers its own interactive visualisations, where users can select criteria to see the connections between data points.
There used to be something here that couldn't be migrated - please contact us at info@journalism.co.uk if you'd like to see this updated!
Visualisation from The Belarus Networks for the connections around Vladimir Peftiev, a businessman described as the wealthiest man in Belarus
Kayser-Bril hopes to add more features in the near future, including a tool to visualise data from tables as a network by the end of January, to make identifying key nodes in a network quickly.
"It's using the maths behind networks to make it super easy for journalists to have like an 'insight' button that you could click and it would tell you 'so this node is the most connected, these nodes are the ones through which information needs to flow to go from point a to point b' so that they can maybe identify persons of interest within the network."
Signing up for a Detective.io account is free but limited, allowing 100 'items' per data collection before a paid upgrade is necessary. Kayser-Bril was eager to stress the open-source nature of the tool, however, and encouraged journalists and news organisations to download and install the software .
"To us, being open source is the standard," he said. "And if you are going to do a tool for investigative journalists you need to be trustworthy and I personally wouldn't use a tool that is not open source for an investigation."
With the Snowden files revealing the scale of information government organisations possess, and when considering the ease with which hackers can access supposedly secure servers, "you never know who to trust" when it comes to third-party websites, he said.
"It depends on the topic of the investigation obviously but if you are going to work on something that can put people at risk, you really don't want to use something that's not open source."