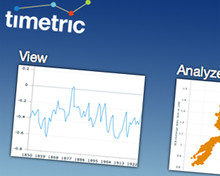
The job of journalists is to present data in a digestible way for their consumers. It was a point well-made by US site the ReadWriteWeb recently, which argued that journalism needs data.
To narrow the point to the UK, take a look at Hitwise's statistics on site traffic, for example: in July BBC Weather was the third most popular British news and media site, ranking above Sky News and the Daily Mail; the Met office site ranks seventh.
Hitwise's analysis from the first three months of the year sugegsts that 17.5 per cent of traffic sent to Google News is for sport-related searches; 6.1 per for weather, 10 per cent for business.
What type of content often does best online? Ranked lists and statistics-based stories. People like numbers presented in tables, graphs and charts. So let's abandon any notion that 'data journalism' is new. But it's a new conversation for many journalists, which start-up data firm Timetric is trying to engage in.
Timetric's vision
Co-founder of the start-up, which graphs, tracks and compares movements of data over time, Andrew Walkingshaw, points out that the interest in data isn't confined to online news: "If you look in a newspaper, an entire sports section, the weather section, the City section: all those are data driven.
"What's really interesting is that data confined to these areas is beginning to bleed out into editorial and opinion, where [normally you'd only see] polling and opinion surveys."
While his team's 'data analysis' site isn't primarily for journalists, Walkingshaw, can see that side of Timetric's business growing.
It currently supplies the Guardian - in an undisclosed agreement - with the fruits of data visualisation and is in conversations with other news organisations.
"What we were doing is building systems for really large amounts of scientific data; the problems with viewing or managing data are pretty much the same across different areas," he says.
"We're going to be rolling out some self-service options soon, but basically we're looking to partner with media organisations who want to get data out to their readers: either in their main content; or in subscription services for specific audiences; or data they've collected which they want to make money on through advertising."
Walkingshaw, and other colleagues from Cambridge University, took previous experience from data analysis in science and 'started to apply it to something more fun'.
"It's making data more digestible and more useful," he says.
"The web needed a good way of dealing with statistics. We didn't think there was one, and we thought we had the skills to build one. A number by itself isn't powerful, without anything to compare it to."
Opening up data
Timetric has a three-fold approach: making data available to users; providing them tools with to manipulate it; and lastly, giving them the ability to share it.
Central to this is 'cleaning up' the data: "We're taking data and translating it into a form where it's much much easier to look at," Walkingshaw says.
"One part of it is collecting data and turning it into a common form: there is value to putting all these in the same interface. You can go away and collect the data yourself but it's not been categorised or cleaned up - it's a lot of work to do that."
Although the team comes from a background in computational physics, Walkingshaw makes the point that scientists aren't necessarily any more skilled in data manipulation.
"The hard part is collecting the data, and finding the bit you used last week and relating it to the other bit. It's not so much the analysis but the librarianship - the filing and the organisation," he explains.
The 'para-journalism space'
While he's working with journalism, he's not 'doing journalism' he says: "There's a lot of us who work in these para-journalism spaces, I suppose - the areas around journalism providing services.
"We're building the toolkit - you wouldn't say Excel [spreadsheet software] is journalism, but you would say Excel is a tool you can use to do journalism. And Timetric is like that: it isn't journalism itself, but it's a tool."
Journalists need to be literate in data analysis, he says: "You make better decisions if you've got more and better information. You've got to have data in a form you can understand and act on.
"Journalism is interesting area because you've got to get your point across really really quickly. You make your arguments as quickly and clearly as you can - and communicate complex ideas."
What Timetric can do, he says, is help 'make it easy to see what the trends are'.
"At the heart of journalism is making it easy to see trends. We collect together all the data about trends and put them together in one place so you get a graph which you can easily embed and share."
Free daily newsletter
If you like our news and feature articles, you can sign up to receive our free daily (Mon-Fri) email newsletter (mobile friendly).


