Visualisation tool Datawrapper can now automate charts
News sites with data feeds, such as financial journalism outlets, can automatically create charts with Datawrapper

– 3 min read
News sites with data feeds, such as financial journalism outlets, can automatically create charts with Datawrapper
This article was migrated from an old version of our website in 2025. As a result, it might have some low-quality images or non-functioning links - if there's any issues you'd like to see fixed, get in touch with us at info@journalism.co.uk.
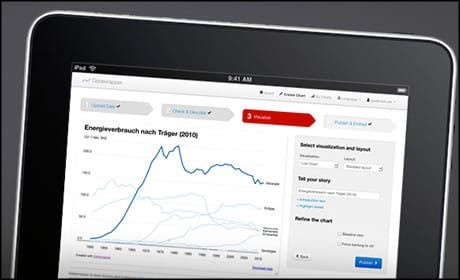
Datawrapper , a tool for creating charts and other data visualisations, has had a major upgrade.
The open source tool was created by data journalists for data journalists and is used by around 1,000 media organisations, including the Guardian, France's Le Monde and Austrian title Der Standard. Here is an example from the Guardian which used the tool to create a range of charts to illustrate how Britain changed under Margaret Thatcher .
One new feature released this week allows news sites with their own data feeds to automatically create charts. Sites can "pump data into Datawrapper" which works as the "engine", Mirko Lorenz, one of those working on the tool, told Journalism.co.uk.
This ability to feed data in and automate charts could be particularly useful for financial news sites. There is a tutorial on how to do this here .
And as Datawrapper has an API and is open source, it can be built on by news outlets. "The Financial Times is using a self-installed version of Datawapper," Lorenz explained. Another recent update sees improvements to the way charts are labelled. "Pie charts got some love," he said. Small values, showing as narrow wedges in a pie chart, are now correctly labelled outside of the pie, for example. Here is the tutorial on charts .
Datawrapper also plans to introduce maps in the near future. "Once released Datawrapper will address a frequent need of many, many editors around the world: cool looking, easy to colour maps," Lorenz, a freelance data journalist for German outlet Deutsche Welle, explained.
Datawrapper has an interesting back story. It came out of the community of data-driven journalists in Germany.
We are deeply journalistic and newsroom-minded in what we try to achieve as we are solving the problems we have ourselves - Mirko Lorenz, data journalist
"We noticed a gap between the visualisation options that you would have using javascript libraries, and the coding abilities that were available to most newsrooms," Lorenz said. "We wanted to shorten this process in getting to quality charts."
With funding and support from ABZV, a journalism training organisation affiliated to BDVZ (German Association of Newspaper Publishers), Datawrapper launched in public beta in February 2012.
"We had some enthusiastic responses although the tool itself was not that good," Lorenz explained.
Gregor Aisch, described as "a rare combination of a very qualified, very productive coder, with a high interest in visualisation and journalism", then joined the team. "That propelled us forward," Lorenz said. "We had found someone who was capable of building such things who cares about journalism."
Datawrapper is unlike most commercial platforms in that it is being developed by journalists. "We are deeply journalistic and newsroom-minded in what we try to achieve as we are solving the problems we have ourselves."
And by making something that is widely used "we have achieved exactly what innovative journalism projects should do".
Six months after it launched in public beta and high-traffic websites started creating and embedding charts, the site reached the first 1 million chart views. Datawrapper is now up to 5 million chart views per month and is growing.
Datawrapper offers customised layouts for some news outlets. That was a feature from the very start, so news outlets were not bound to "cross-promote" an external tool, as Lorenz put it.
Going forward and looking to sustainability beyond the initial two years of funding, the plan is to support three versions of Datawrapper. The model is similar to WordPress, which is open source and has free and VIP options.
The free version will be called Datawrapper Public – "you will just use it, embed your charts and off you go", Lorenz said; the second option is Datawrapper Community, "where we try to activate knowledgeable developers around the world"; and Datawrapper Pro will be a personalised service, with the Datawrapper team on hand to install, customise and maintain the tool.
They are now carrying out the first two tests with paying clients, one from Switzerland and one from the US.
The platform has already notched up 22 million chart views in the past 18 months. "My best guess is that it will grow further," Lorenz said.


