

For any story with a geographical element to it, using some form of mapping imagery to covey the location-relevance of a story only helps to better inform the reader, and if you can also make it interactive then that is another tick box for engagement.
So StoryMapJS, a free tool from the Northwestern University Knight Lab, is a great platform to tell such stories on, as it combines both maps, multimedia and interactivity – a digital storyteller's dream.
An "authoring" version of the tool was recently launched in beta, an earlier alpha "developer release" was unveiled late last year, and highlighted by us in October as one of a number of great tools for journalists from the Knight Lab, alongside counterparts such as TimelineJS and Soundcite.
The latest version features a redesign placing the map and descriptions for each piece of the story "side-by-side" rather than on top of each other.
This change to the design was "a key moment", Knight Lab's Ryan Graff told Journalism.co.uk. The "design is a little slicker than it had been", he explained.
It has also teamed up with Mapbox to help users of both platforms carry over existing formats, and introduced an alternative tool called Gigapixel, which lets journalists take readers on a journey through an image, rather than a map.
Graff explained that this could be used, for example, to identify individuals in a photo of many, describe the features within a painting, or even to take the reader through a make-believe map, such as it did recently on a Game of Thrones themed Gigapixel.
In this how-to guide, however, we are going to focus on how to create a map-focused StoryMap, to deliver a location-themed story and bring together images, links and video to create an immersive experience.
For the purposes of this guide, I have created a StoryMap from scratch, which looks at just some of the journalism conferences Journalism.co.uk plans on attending and covering across Europe in the coming months.
Other examples of how the tool has already been used by news outlets is this recent Al Jazeera America StoryMap which tells the story so far of Malaysia Airlines flight MH370.
This example on the Olympic torch relay also illustrates how the tool can be used to give an overview of a multi-location event.
So, how can you build your own? The first step is to link the tool up to Google Drive.
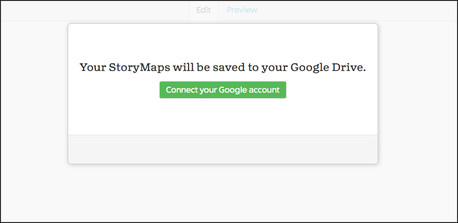
Once you have done that, you can start building.
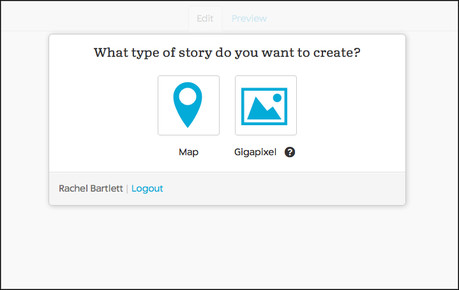
As I explained earlier, for this example I am focusing on building a map, so if you want to tell a map-related story, click Map. You will then need to give the interactive a name.
You will now be presented with the StoryMap dashboard, as shown below, on the first page of your interactive.
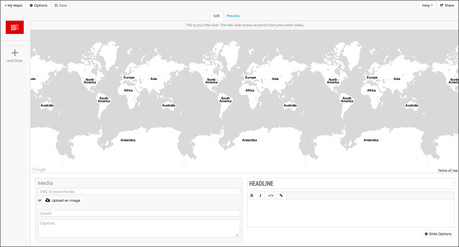
The first 'slide', or page of your StoryMap interactive, is like a front page.
The map that will show in your end product will be based on the points of interest you indicate as you create your final piece.
So, for example, if I was creating a StoryMap which only focused on locations within the UK, the final front page map would focus in on the UK.
However, if the map, as I have in this case, also included references to parts of Europe, then the front page map with scale out accordingly.
So for now, you do not need to worry that it is showing multiple copies of the world map, this will change as you build your StoryMap.
To create your front page you need to add a headline for the entire piece, and you can also add more detail in the box underneath. There are options to make text bold or italicised, and you can also add links.
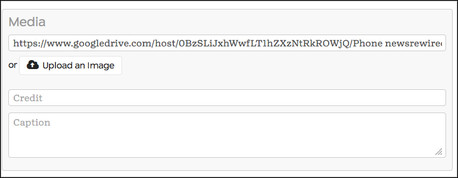
There are also multimedia options for every page you make. This means you can add an image, either by uploading from your computer, which will be saved and then accessed via your connected Google Drive account, or by pasting in a web URL for an image, or YouTube or Vimeo video.
You can find instructions on how to get a web URL for content in your Google Drive or Dropbox accounts via this page on Gigapixel (click the 'show me how' link).
Once you have added your media, there are then fields with the option to add a credit and caption.
Once you have made your front page, you can move on to creating your location-based pages. Click 'Add Slide' on the left hand side menu, and once again you can add a headline, description, links and any corresponding image or video.
On these pages, vitally, you add the relevant locations to your map, one per slide. You can type in the location, whether it is a building, street name, city, country, and you can toggle the zoom bar in the top left-hand-side to enable you to drill down into your area of interest.
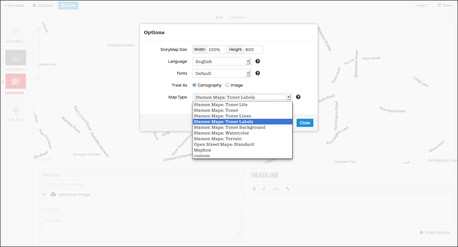
It is also worth noting at this point there are further customisation options available. For example, you can change the map style, background colour behind your text and the font itself via the 'Options' and 'Slide Options' buttons.
And then it is simply a case of adding a new slide for each new location, until you have your completed story.
Once it is finished, click 'Share' where you can access a link to a StoryMap hosted version of the interactive, to share that link on social media networks, or the embed code to publish it on your own site.
The embed code is responsive, Graff explains, which means that it will adjust the size and layout of the interactive based on the space into which it is placed.
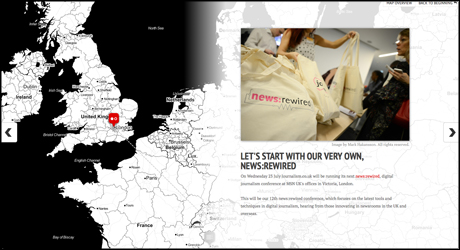
For example, I have pasted the embed code for my sample StoryMap into this article below, which is in a space 460 pixels wide, causing the interactive layout to alter so that the map is placed above the text, rather than to its side.
Each slide is represented by a pin, which also carries a logo to identify whether there is an image, video or just text attached. You can navigate through the interactive from slide-to-slide by clicking the right and left arrows, or by clicking on the pointer for the slide you wish to travel to.
In comparison, if you view it at this link, where it is able to fill the entire screen, you can see the different layout this allows. I have also tried to show this comparison in the screenshot below:
Update: This article was updated to correct the name of the tool's creators to the Knight Lab at Northwestern University, not the Knight Foundation Lab.
Free daily newsletter
If you like our news and feature articles, you can sign up to receive our free daily (Mon-Fri) email newsletter (mobile friendly).


